UNDERWRITING
a new world
2020 Annual Report

Tree Line is structuring current yield solutions to help our limited partners combine yield with discipline in a time when consistent performance is in short supply
Jan. 2020
“We will be the last to predict when a market will shift but we will acknowledge that it can happen quickly. To that end, we will remain relentlessly focused on the fundamentals to ensure our portfolios are well positioned to perform through any uncertainty that lies ahead.”
Tree Line Market Insight:
Direct Lending In An Uncertain Environment
July 10th, 2020
To our
investors,
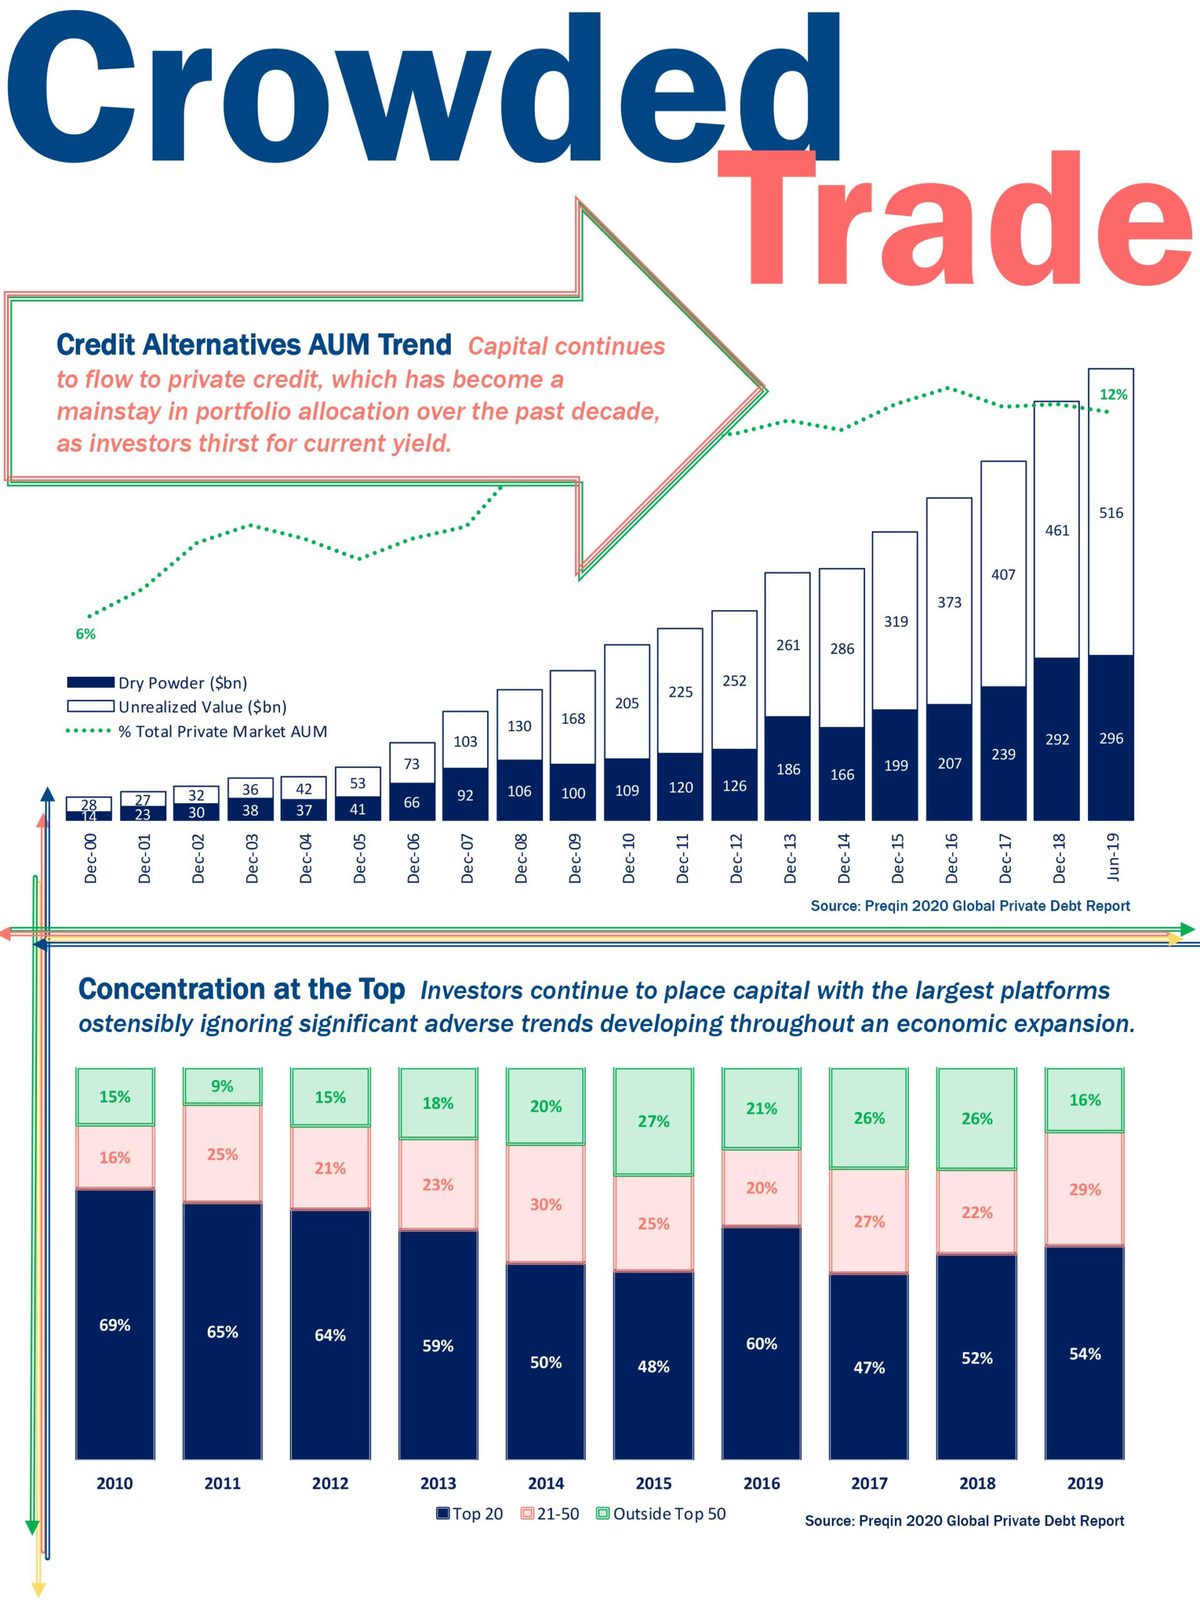
In June 2019, the cover of our Annual Report included a key theme, “Preparing for a Recession”. In January 2020, we published a short paper entitled, “Lending in an Uncertain Environment”, which highlighted the need for discipline as we entered the tenth year of an economic expansion. Having been direct lenders before, during and after the Great Financial Crisis, themes of caution and discipline remain at the forefront of Tree Line’s investment strategy. We simply believe it is what should comprise a lender’s DNA. Over the past five years, the credit market followed a familiar pattern where fundamentals were sacrificed while being rewarded with record inflows of capital creating a recipe for defaults and losses.
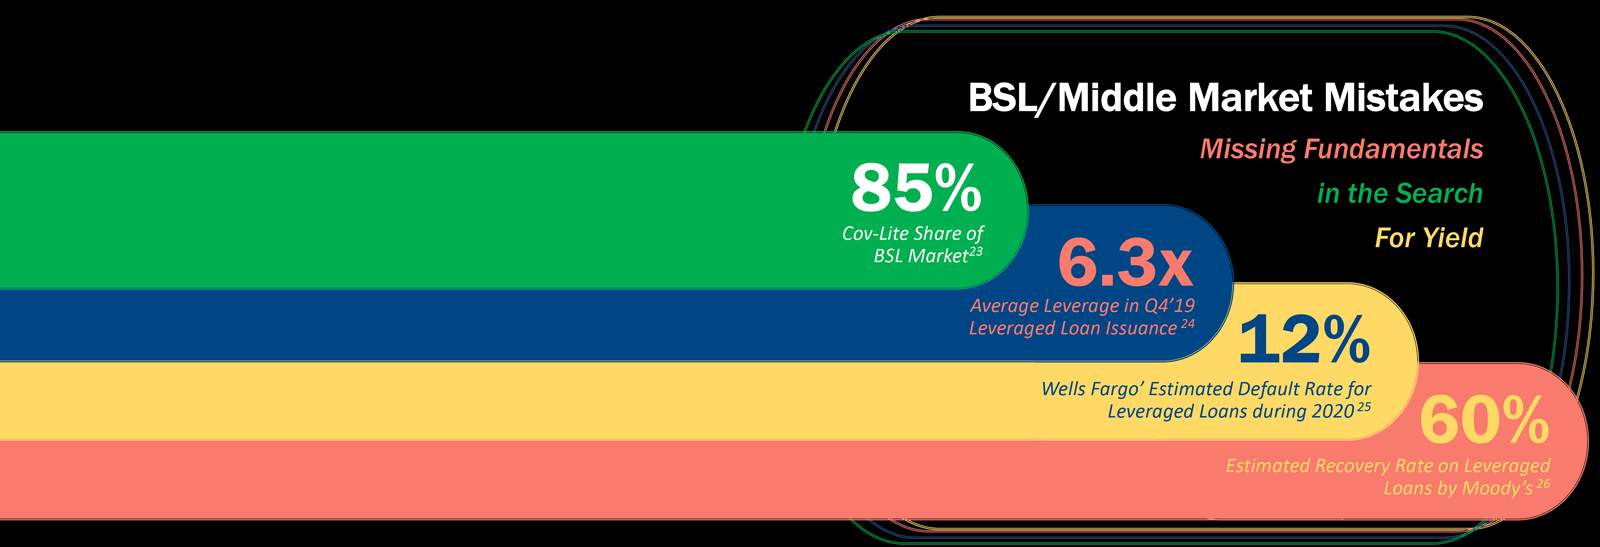
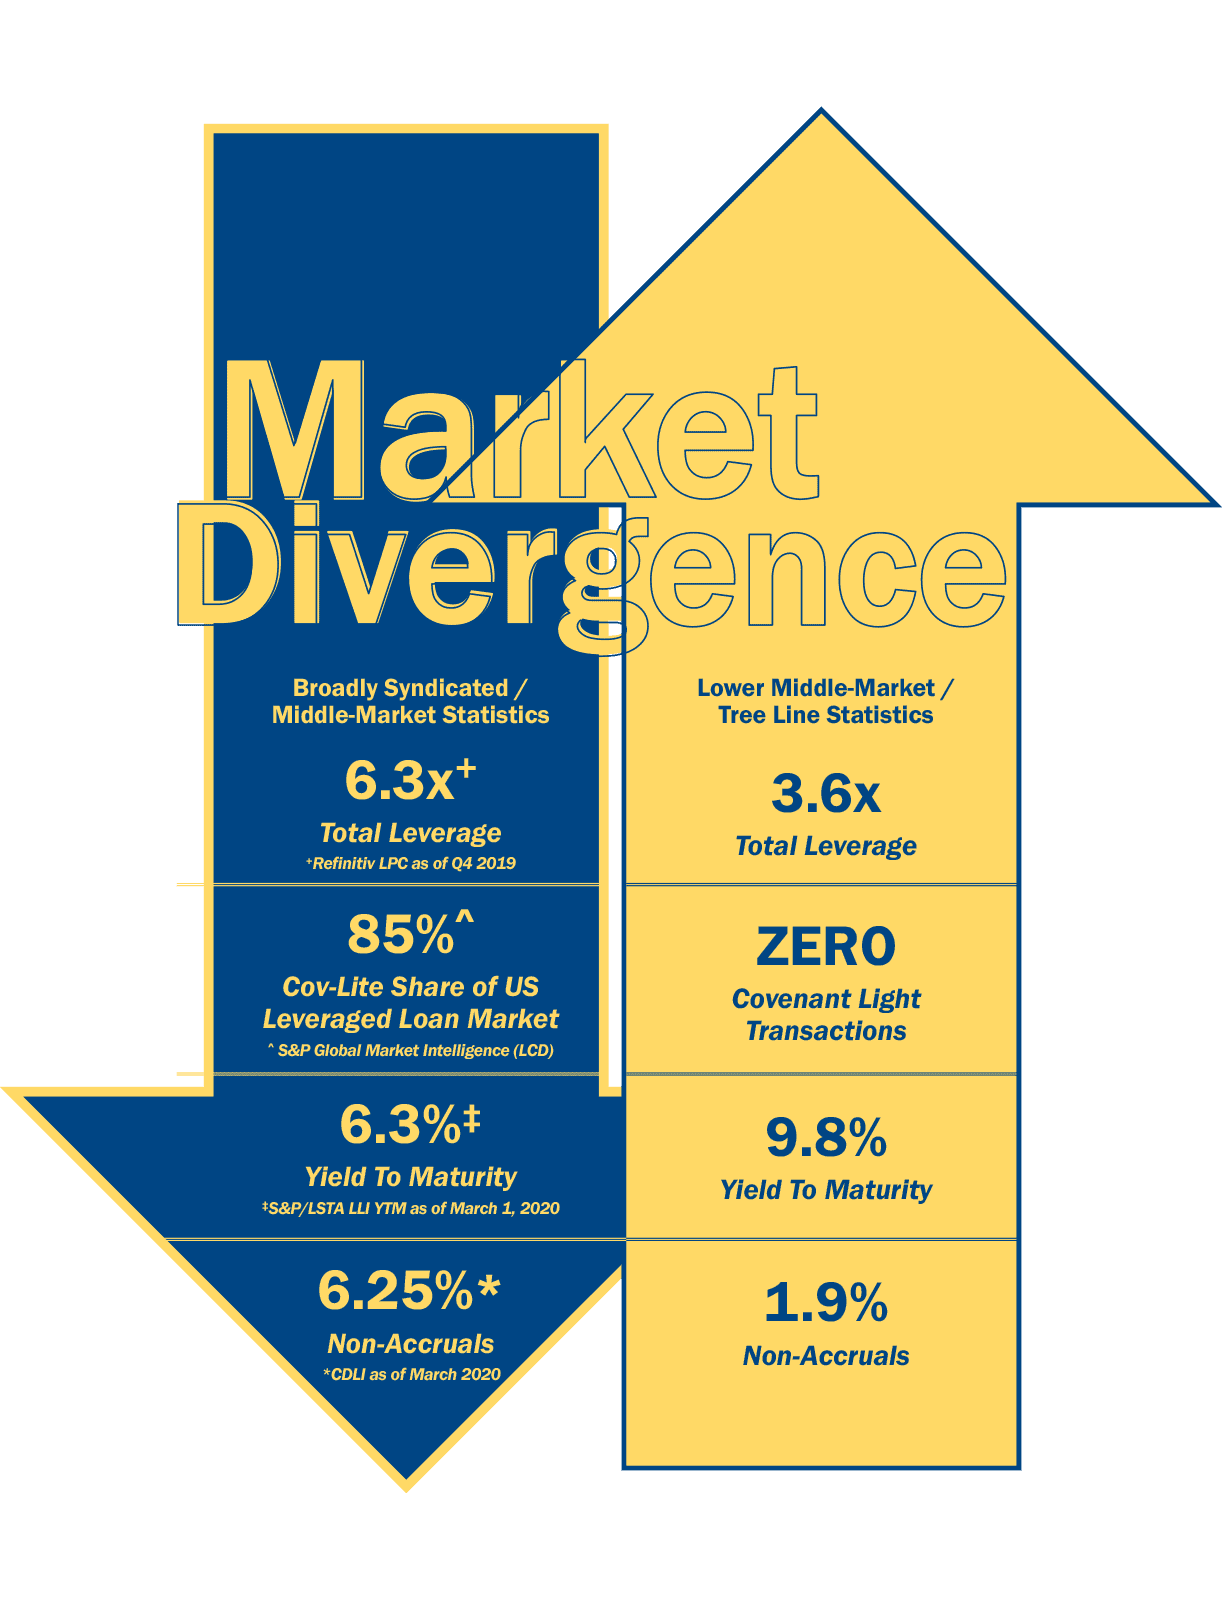
A shortsighted narrative took hold throughout 2019 which was that covenants are overrated, and that record high leverage levels should present no concern so long as a large company is present. These themes, combined with subtle, yet extremely impactful, changes which erode the strength of a credit agreement have weakened the position of many large lenders. At the peak of the cycle, it was counterintuitive to us that lenders would brazenly advocate to take more risk for less return in riskier structures. At Tree Line, we worked each day to do things differently. Our underwriting ecosystem, defined by three key components, Strategy, Data and Experience, requires an unrelenting focus on the fundamentals as is critical to success for any lender investing late in a cycle. It’s our belief that it’s what you do at the peak that earns you the opportunity at the trough.
Underwriting A New World
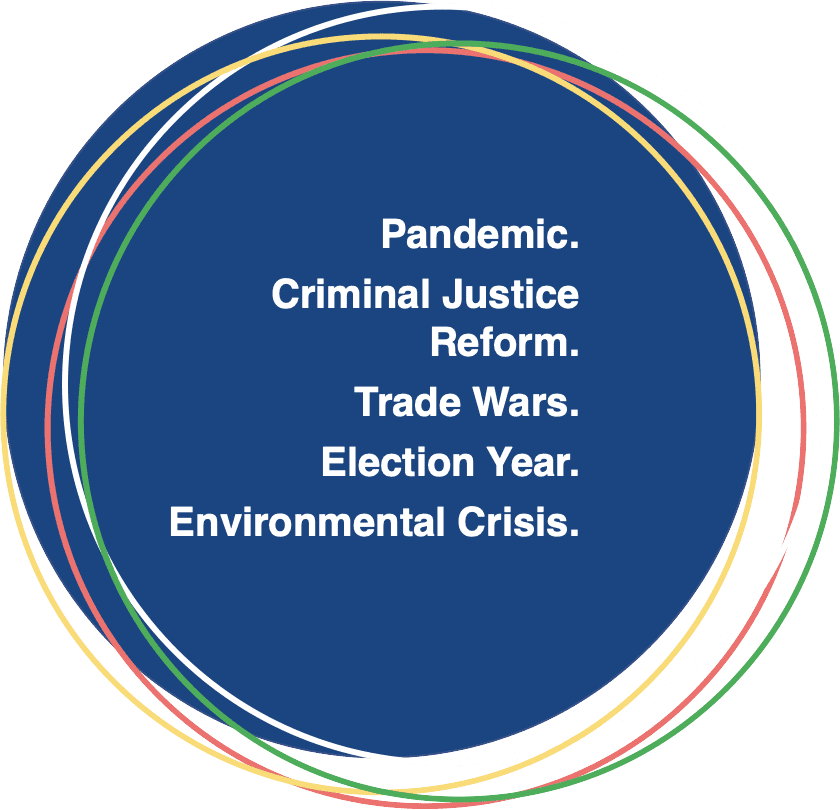
We could never have scripted the events that would take place in the early months of 2020. The first half of the year has confronted us with a pandemic and demands for social reform, alongside a trade war, reflation, and a significant shift in how we work, commute, travel, shop and interact as human beings. Billions of lives around the globe have been impacted by these events in profound ways.
As people, we gained perspective through these trying times which brought our team closer together even though we were working apart.
We have been focused on expanding our ESG policy to drive an impact in our community. At the start of the year, we joined 1% for the Planet, and will contribute 1% of our management company revenue to support environmental causes. In May, our team made personal contributions, matched by Tree Line, for over $58,000 to those impacted by COVID. Finally, in June, we renewed our focus to build a diverse culture and will explore the lengths that we can partner with our investors to leverage our ESG policy to effect positive change. As challenging as the recent events may have been, we are energized at the role we can play in an ever-evolving world.
We are a dynamic, young, diverse team that welcomes the responsibilities that come with managing capital on behalf of our investors in today’s world.


As direct lenders, we gained further insight into the strengths and weaknesses of our portfolio and investment strategy. We mobilized a tremendous response to monitor and manage the impact of COVID. Market volatility placed uncertainty on portfolio valuation across our industry. As hold to maturity lenders, we can absorb short-term market gyrations. Our loans are structured with significant cushion and through senior secured rights and covenants enable us to properly manage and influence liquidity across our portfolio. We are incredibly pleased with the effort our team has given in the face of this tumultuous year. Our team remains highly focused on two key fronts.
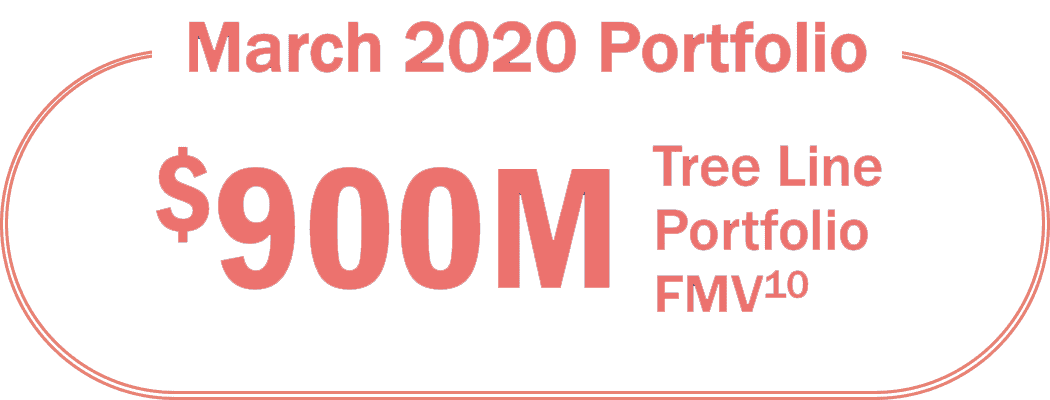
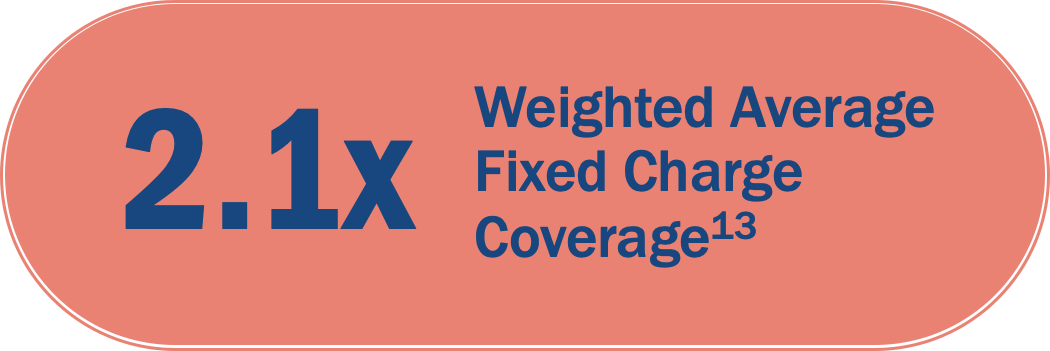
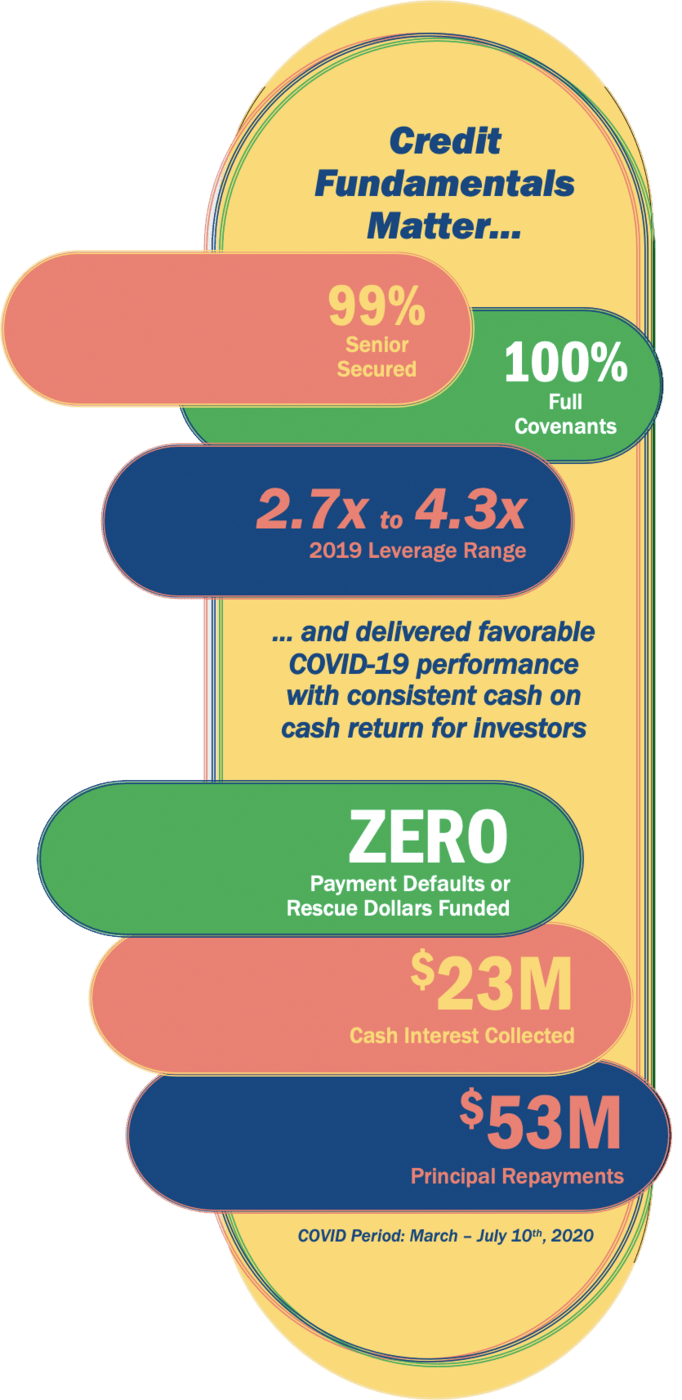
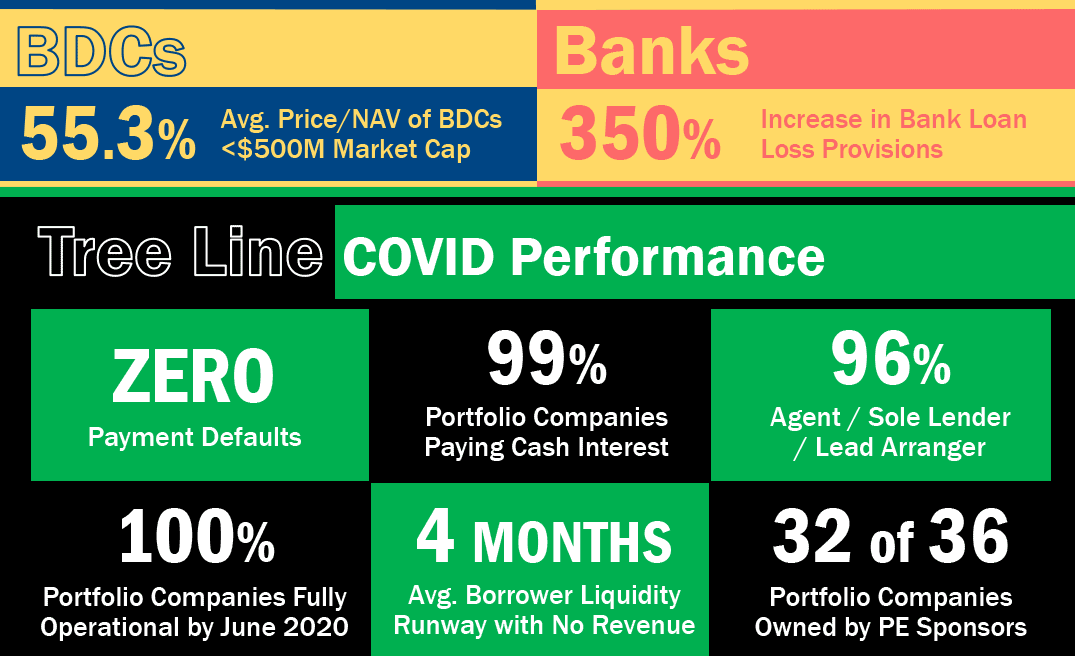
First, the continued performance and recovery of our portfolio. Our portfolio construction strategy which emphasizes directly originated, senior secured, low leverage, high free cash, full covenant, sponsor- backed loans put us in as strong of a position as possible entering the crisis. As of March 31st, 2020, our portfolio was $900M in fair market across 36 portfolio companies carrying a weighted average leverage of 3.6x and a fixed charge coverage of 2.1x. Following months of intensive portfolio monitoring work, where we customized specific COVID monitoring plans for each borrower with a heavy focus on liquidity, our portfolio has been proven durable. To date, we have incurred zero payment defaults and have funded zero rescue dollars as a result of the crisis.

In times of market dislocation, direct relationships are essential. We are the Agent and/or Lead Lender in 96% of the deals across our portfolio.
Direct relationships provide us with immediate and unfiltered access to borrowers where, in the case of COVID, we were able to increase reporting requirements to track daily and weekly trends during the most dynamic time of the crisis. Tree Line’s comprehensive COVID monitoring plan, shared with investors in numerous updates over the past few months, allowed us to establish a liquidity baseline at each portfolio company to measure cash burn to ensure we could take action well in advance of an issue.
Second, we must now begin to underwrite a new world. As we enter the beginning of a recession, triggered by a global pandemic, we will inevitably witness a significant change to business models, supply chains and regulations. The current environment calls for caution, yet we recognize that post-crisis performance data will be highly valuable in analyzing company and sector stability and outlook. The average age of our portfolio companies is 19 years, which provided Tree Line the ability to study a company’s performance before, during and after the Great Financial Crisis. This data was incredibly important to understand a company’s ability to withstand volatility and rebuild its revenue to pre-recession levels. COVID will now provide us with this much needed data after 10 years of economic expansion.
PERFORMANCE, Growth & Technology
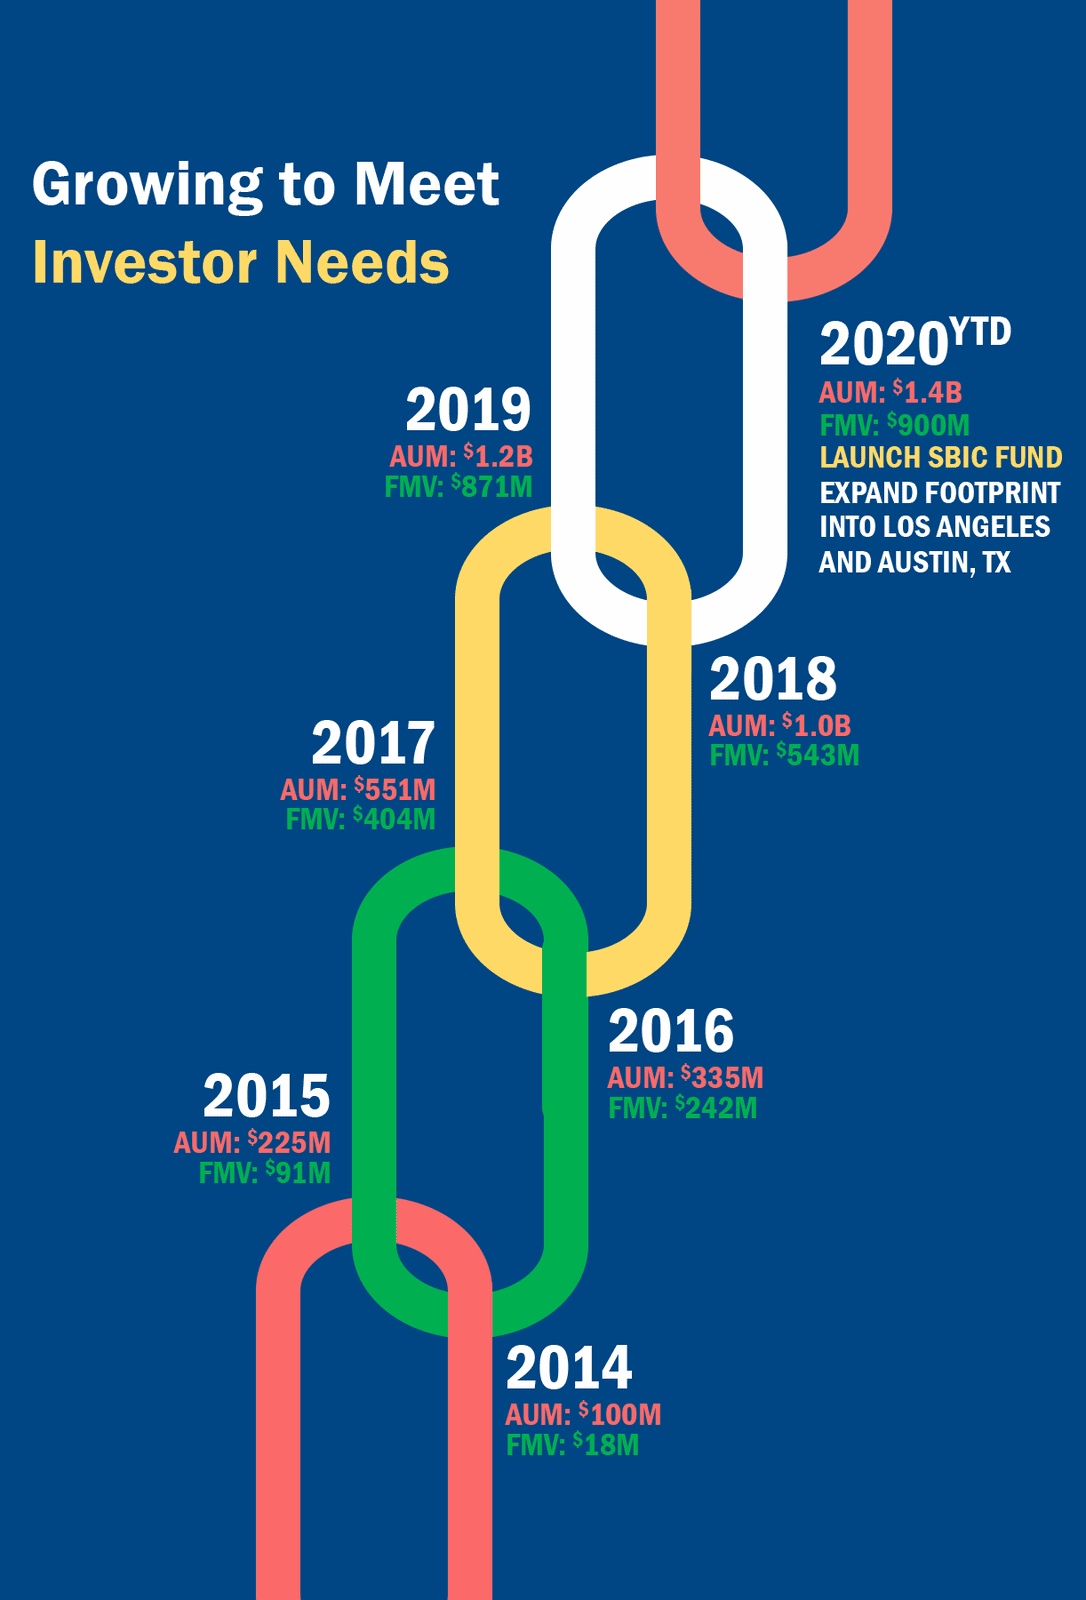
Tree Line, in its seventh year of operations, continues to execute a thoughtful and measured growth plan while delivering record performance across the platform. Too often have we seen scale and growth become the enemy of return and consistency in our industry.
At Tree Line, we aim to build market share with a long-term view as we hold our investor, employee, sponsor and borrower relationships as our greatest assets.
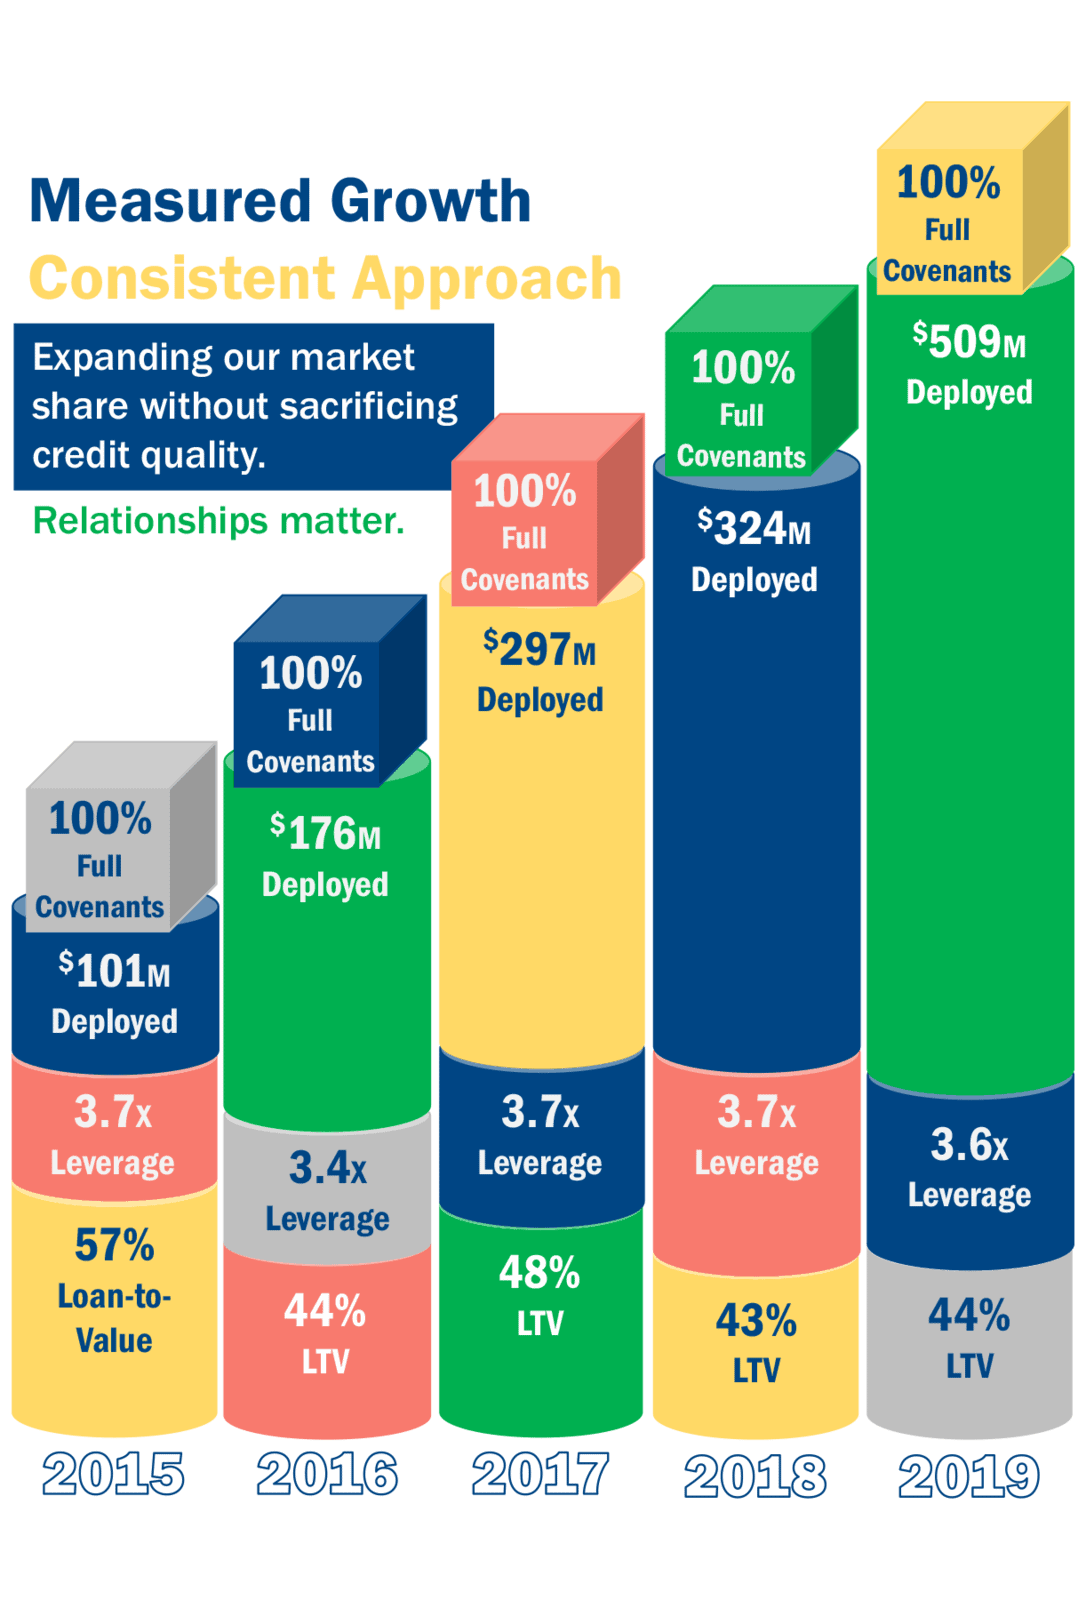
Market conditions are a key factor to determine the appropriate pace for responsible growth. While many private credit platforms grew considerably faster during the economic expansion, it may come at a cost. Tree Line limits its fund sizes to reflect reasonable annual origination targets that favor deal selectivity over growth. We execute a niche lower middle-market strategy to ensure responsible deployment in disciplined credit structures. As a result, amidst this crisis we remain healthy and liquid as a clear leader in lower middle-market direct lending. We expect the bar for new deals to be extremely high but also are confident we will be able to capitalize on this market dislocation, which may involve consolidation of private credit managers, and deliver this value to our investors.
Our platform has never been stronger. Assets under management now sit at an all-time high and total $1.4B. We manage six direct lending funds which include evergreen, call & return and SMAs. We have created a suite of funds offering investors flexibility in how to access our platform. We have issued $1.6B in loan commitments to 107 companies with 2019 origination totaling $480M across 13 new platforms and 21 follow-on financings. Tree Line was the Agent/Lead Lender in 12 of the 13 new transactions and sole financing partner in 10. Follow-on financings, in a highly acquisitive lower middle-market continue to be an incredibly important source of proprietary deal flow. Sponsors continue to select Tree Line on a repeat basis in a competitive environment. As important, the consistency in our deal flow and credit metrics are a testament to our commitment to capital preservation.

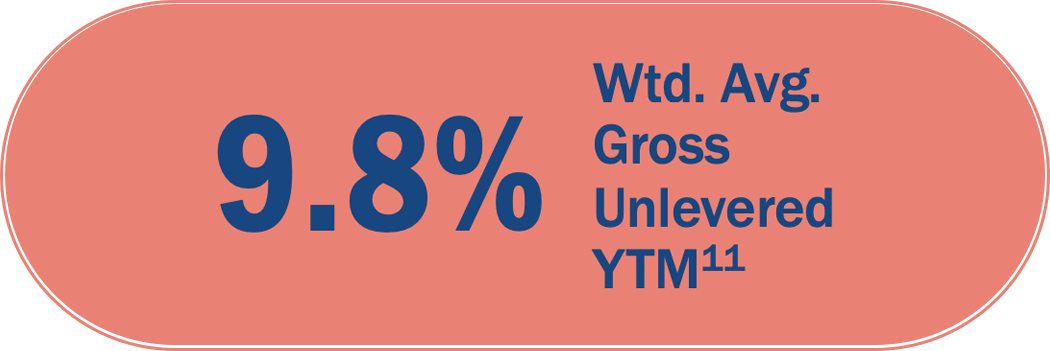
In 2019, at the peak of the cycle, we delivered record origination volume without sacrificing our credit standards. The 2019 vintage was comprised of 99% senior secured loans carrying a weighted average leverage of 3.7x with the maximum leverage to a single deal of 4.3x, a fixed charge coverage of 2.1x, a weighted average unlevered gross cash yield of 9.3%, LIBOR floors of 1.7% and 100% full covenants. These metrics are highly consistent with 2015 and that speaks to the consistency of our market versus what occurred in the middle and broadly syndicated loan markets where leverage spiked, and covenants were gutted.
In periods of extreme economic volatility, cash is king and does not lie. From March 2020 through the date of this letter, and amid COVID, we collected $23.4M in cash interest, received $52.6M in principal repayments while only funding $7.0M in net revolver draws. Additionally, we’ve generated $1.8M in fees and excess return as a result of amendment requests. The performance of our portfolio and our ability to generate current yield for our investors through the initial three months of a pandemic and recession speaks volumes to its durability.
Tree Line’s Commitment to Data and Research
Tree Line’s approach to underwriting will continue to be centered on data. We have allocated significant time and energy to our data driven approach and market research. Leveraging our nearly 20 years of direct lending experience, we have designed and implemented an algorithm to score and filter deals to minimize risk that presents a higher likelihood of default. Our strategy is proving to be a winning and enduring formula in the face of the COVID challenge as our zero payment default rate meaningfully outperforms the high yield, BSL and BDC market.
Since inception, we have screened over 3,000 loan opportunities. The deep and unique access we have to the lower middle-market provides us with extremely valuable data. We work to combine the data we directly collect with research we perform on the BDC space. We have studied loan performance across thousands of loans, with a specific focus on loans valued less than 80% of cost, to build a searchable lower middle-market database of underperforming transactions.
Studying and understanding poor performance across a statistically relevant population of loans will aid our efforts to properly filter out opportunities with elevated levels of risk tied to specific business models.
Tree Line will make a significant and long-term commitment to this effort as we believe it has great potential to further differentiate our performance from our peers.
COVID & Recession Market Impact
COVID was the unforeseen catalyst that finally broke the 10-year bull market and exposed credit firms’ unprecedented levels of risk. The world came to an abrupt halt in a way that would have been a failed plot line on Billions. Few could wrap their heads around the global economy shutting down so swiftly. As COVID became a reality in the U.S. in March, we pulled back on efforts to originate new deals as pricing and underwriting risk became too challenging in such a volatile environment.
Tree Line directed the full resources of our team to engage with our borrowers to assess current key performance indicators, liquidity and revised forecasts which we were able to synthesize into investor updates.
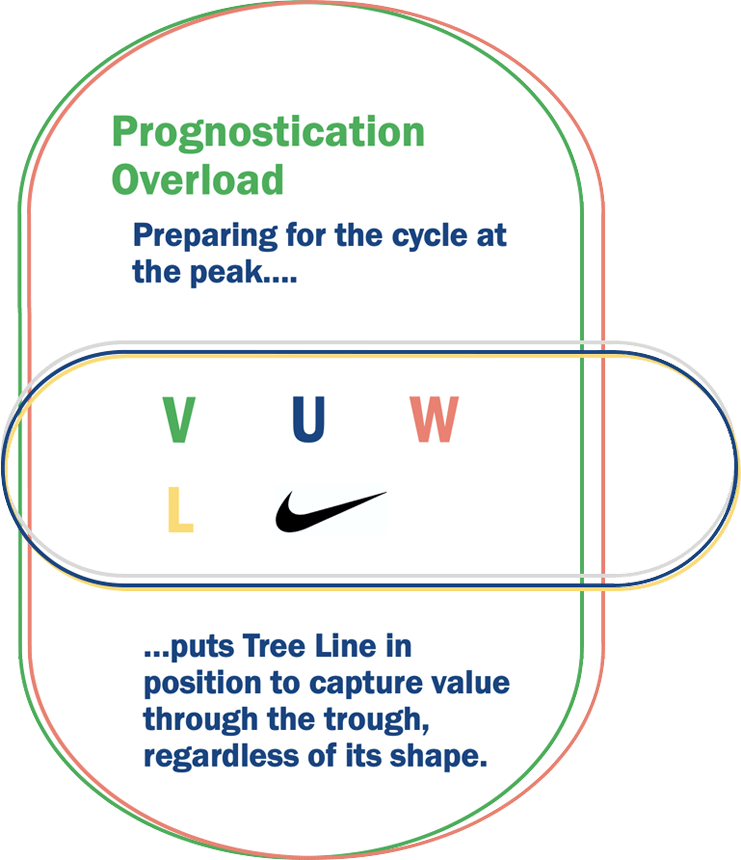
Following months of intense portfolio monitoring during shelter-in-place mandates, the U.S. economy is reopening, for now. The environment remains volatile and unpredictable which needs to be acknowledged. We have heard from experts projecting recoveries ranging from a V, U, L, W and Nike swoosh. As the date of this letter, a V certainly looks to have prevailed in the public markets, likely driven by Fed activity and a resultant reflationary environment. However, we are far more interested in the unique insights we gain through our 36 portfolio companies across 19 sectors in the U.S. and the extensive research we have done across the lower middle-market and middle-market.
Companies impacted by COVID are showing steady and consistent gains in each week’s performance following a bleak April, which is encouraging. However, our data still tells us that there is a large disconnect between Wall Street and Main Street.
As resilient as our portfolio has been and with many furloughed jobs being rehired, permanent layoffs are being implemented across many companies to counter reduced demand. We need to anticipate a protracted recession.
Many companies improved liquidity through the Paycheck Protection Program, revolver draws and initial cost cutting but these are likely short-term solutions to what is potentially a longer-term problem. As the second half of 2020 is upon us, notwithstanding the possibility of a second wave of COVID taking hold, our focus will shift to monitor the impact of a recession where we will place focus on three key pieces of data for those companies impacted by COVID.
First, a company’s pre-COVID performance benchmark, which was likely FYE 2019 or LTM February 2020. Second, a company’s ability to manage through the brunt of shelter-in-place mandates. This largely proved to be a litmus test with heavy emphasis on liquidity, the strength of a management team to navigate market volatility, implement cost rationalizations and maintain a healthy balance sheet. Third, which will take time to evaluate, the rate at which a company can return to their pre-COVID performance benchmark. This is what we will ultimately look to over time to assess and price our underlying risk. This approach assumes there is not a major setback due to a second wave in which case we would likely revert to a focus on liquidity.
We anticipate there will be companies that may have fared well through shelter-in-place but could be more impacted by a recession and high unemployment. Overall, our underwriting has served us well and the debt case within each of these companies affords us the necessary cushion to withstand both COVID and recessionary challenges ahead.
Dislocated, Distressed, and Direct Lending
We have observed a swift shift from a frothy credit market to a scramble for distressed assets. We find it interesting that in many cases it’s the same firms that were participating in the froth are now raising distressed funds.
The years following the Great Financial Crisis were a meaningful time of growth for many private credit managers with new entrants filling the void in middle-market lending. With banks consolidating at a rapid clip coupled with increasing regulation, distressed players benefited from discounted portfolio sales.
Today, COVID has created a similar buzz in the market with “dislocated”, “distressed” and “opportunistic” being used ad nauseum. Much of the speculation has been that private credit managers, including direct lenders, would present a huge opportunity for distressed buyers.
We see significant differences between the effects of the Great Financial Crisis and COVID which, in our opinion, will not enable distressed investors to build a pipeline of direct lending opportunities as advertised. Banks were under severe pressure in 2008 and 2009 as regulated entities, with the financial system threatening to fail, many had to unload portfolios to shore up their balance sheets.
As it relates to the direct lending space, assets are predominantly held by BDCs and private platforms which are significantly less regulated than banks and virtually all are designed to be hold to maturity lenders. Even in the face of a distressed loan or portfolio, these groups are predominantly prepared to workout their own paper as the bid from a distressed investor is rarely viewed as an appealing exit option. Yes, there will be exceptions where assets and portfolios trade, but we don’t believe it will be widespread or material.
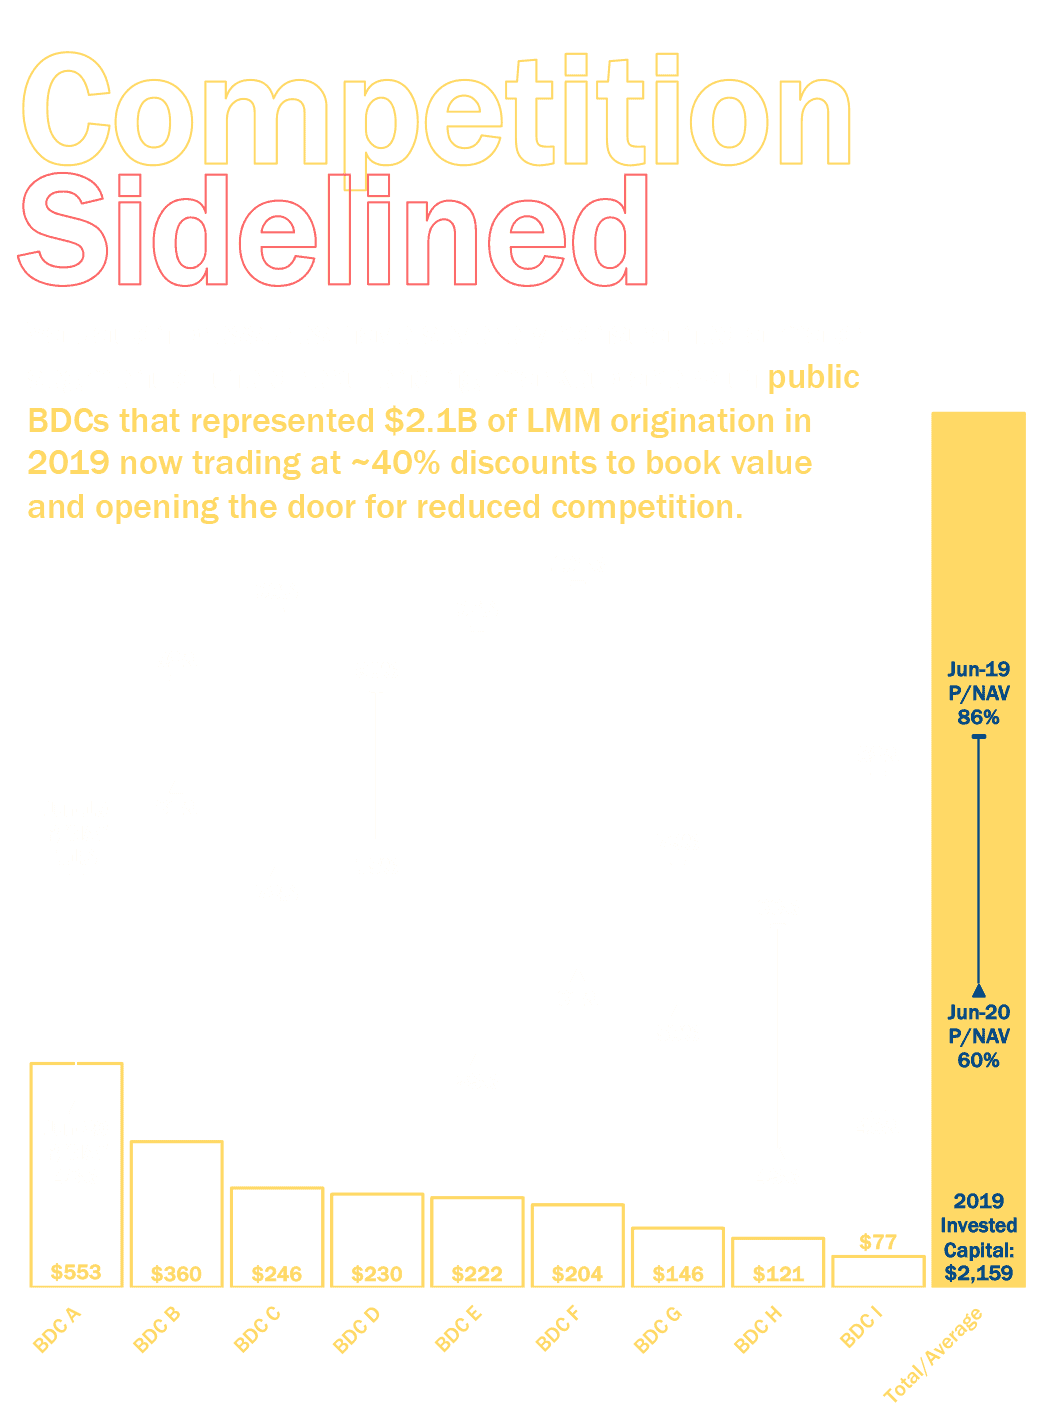
However, while direct lenders may not be executing fire sales as many had projected, we believe a more likely scenario is that many will become “zombies” where they offer a borrower or sponsor little ability to support growth. Private equity firms, looking for lender stability and potentially growth capital, will target new lenders. Tree Line will directly benefit from an expanding opportunity set as BDCs and private credit platforms untangle themselves from years of irrational investment decisions. We do not expect distressed players to gain access to our channel but do expect Tree Line to capture additional share as our competitors struggle with underperforming portfolios, leverage facility defaults and an inability to raise new equity while BDCs trade below NAV. Tree Line’s BDC competitor set, who have less than $500M in market cap, maintain total loan portfolios of ~$5.6B as of March 31st, 2020, and were responsible for over $2.1B in 2019 origination. BDCs, being public vehicles, and with an average beta of 1.42 for lower middle market managers, are greatly impacted in times of economic volatility. A group of nine lower middle market managers’ price to NAV dropped from an average of 0.86x in June 2019 to 0.60x in June 202022. The valuation impact at these funds will greatly limit their ability to issue new loans and significantly reduce competition in the lower middle-market. This is a relationship business based on direct calling efforts and long-term relationships with private equity firms. Tree Line will have an opportunity to displace its competitors creating a wider opportunity set as a recession unfolds.
Our investment philosophy and portfolio construction strategy are designed to withstand unforeseen events and capitalize on market dislocation. The 2010 – 2012 vintage of deals performed exceptionally well with high yields and virtually no losses, as reported by BDCs during this period, and we expect a similar opportunity set to present itself going forward.

Tree Line’s Commitment to Capital Preservation
We founded Tree Line to provide investors access to the lower middle-market through an institutional quality platform. We work daily to combine a relationship approach with our investors with a platform built on scalable technology solutions. Our value proposition to investors is and will continue to be to deliver consistent yield with a focus on principal protection and minimized volatility. The true measure of a direct lender is found in its consistency to perform in all phases of a cycle.
For the past six years Tree Line has made daily decisions that reward fundamentals and penalize unnecessary risk to construct a durable portfolio designed to withstand a recession. We are equipped to manage the challenges ahead given the senior secured rights and remedies that we hold. Today, our portfolio is performing and continuing to generate reliable cash yield for our investors as we remain focused and prepared on unforeseen challenges ahead. As lenders, we will remain highly cautious in this new environment yet acknowledge the opportunity in the near to medium term to capitalize on an embedded element of our strategy, dislocation, that has not been meaningfully present since our inception.
In 2020, a year where the world is facing unprecedented change, Tree Line has never been stronger. Our platform, brand, team and culture are thriving and poised to expand on the successful work we have done to date. We remain highly appreciative of the support our investors have shown us and remain excited by the work we can continue to do together. While we recognize our world is changing dramatically, we are optimistic about what lies ahead. A world that presents change, presents opportunity and we are prepared to underwrite a new world.
Sincerely,

Tom Quimby
Managing Partner

Jon Schroeder
Managing Partner

Frank Cupido
Partner

Tree Line Delivers
Yield
&
Discipline
Buy & Build
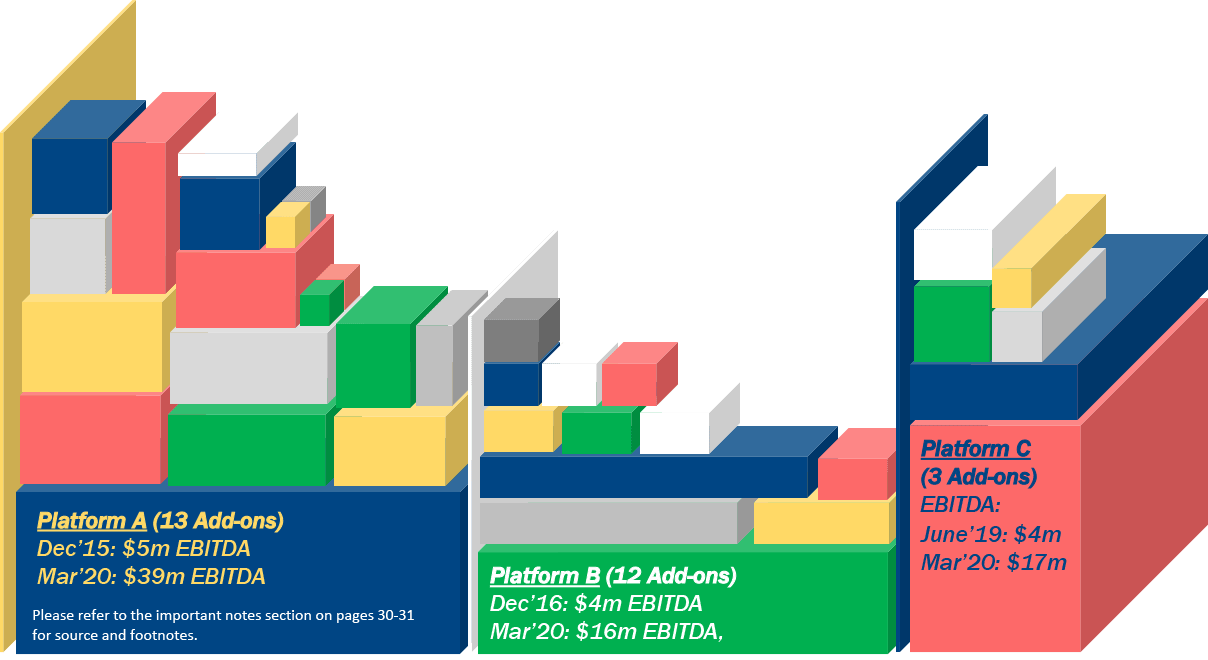
With valuation multiples elevated throughout the private markets, sophisticated Private Equity Sponsors have increasingly turned to buy-and-build strategies in the Lower Middle-Market to take advantage of more attractive valuations and the opportunity for multiple arbitrage.
Tree Line has provided follow-on financing for 50 add-on acquisitions with $351M in capital to help transform regional and niche leaders in the Lower Middle Market into larger, stronger, and more diversified businesses that attract premium valuations in today’s markets.
Discipline
at the Peak
Opportunity
at the Trough

Chance Favors Only the Prepared Mind.
– Louis Pasteur
COVID exposed many lenders carrying too much risk or too little liquidity. In late March and into Q2 2020, many lenders dumped revolving commitments they could not cover, explored not funding through Material Adverse Effect clauses and suffered tighter restrictions from fund leverage providers. A significant amount of lending capacity has been sidelined as a result of COVID.
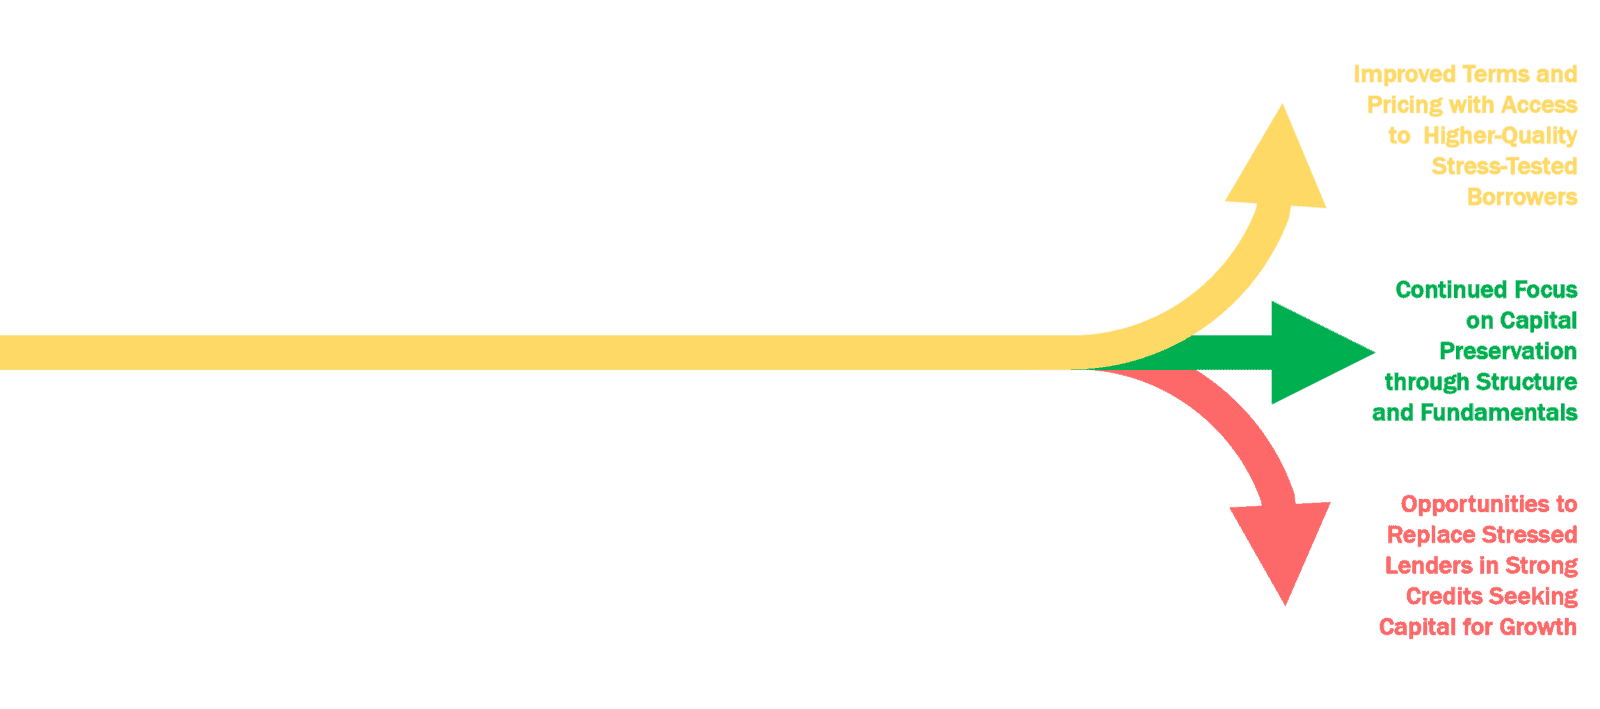
Tree Line remains healthy, liquid and poised to capitalize on the further dislocation in the lower middle-market to middle-market. Our opportunity set is expanding at an incredibly valuable time where we can underwrite companies from a recent stress test. The data available to us today is the best data we’ve had in nearly 10 years. Being able to successfully deploy at the peak of a cycle is the ultimate test of a lender and if done properly, the reward counterintuitively lies at the bottom of the cycle.
Patience & Discipline Rewarded
Investing at the trough provides healthy, liquid, and disciplined lenders the opportunity to capture peak risk-adjusted returns.
Disclaimer
Opinions
Opinions expressed through page 30 are those of Tree Line Capital Partners, LLC as of July 2020 and are subject to change.
Tree Line Data Points
All data through page 30 reflects YTD March 2020, unless otherwise noted.
The information provided herein with respect to TLDL, TLDL (SC), TLCS, and TLDL II (as defined on the Footnotes / Glossary page) has been provided for informational purposes only and does not constitute an offer to sell, or solicitation of offers to buy or convert, securities in TLDL, TLCL (SC), TLCS, TLDL II or any other existing or to be formed issuer. Investments in TLCS and SBIC II can be made only pursuant to a subscription agreement, confidential private offering memorandum and related documents and after careful consideration of the risk factors set forth therein.
An investment in TLDL, TLDL (SC), TLCS, TLDL II or SBIC II is speculative and involves a high degree of risk, including risks related to the use of leverage. The performance of TLDL, TLDL (SC), TLCS, TLDL II, SBIC II, and its investments may be volatile. An investor may lose all or a significant amount of its investment. It is anticipated that there will be no secondary market for such interests and, in the event that an investor is unable to redeem its interests, the interests will be illiquid. Further, such interests will be subject to legal and contractual restrictions on transfer. The performance of debt investments could be adversely affected if the issuers of the instruments default or if events occur that reduce the creditworthiness of those issuers. If a note or other debt instrument were to become subject to such an event, the value of the instrument could be significantly reduced, conceivably to zero. Investment in such interests is suitable only for sophisticated investors and requires the financial ability and willingness to accept the high risk and lack of liquidity inherent in the investment.
This presentation contains forward-looking statements relating to the plans, objectives, opportunities, future performance and business of Tree Line Capital (as defined on the Footnotes / Glossary page) and the future performance of the debt markets in North America generally. Statements regarding anticipated returns, forecasts and projections rely on a number of economic and financial variables and are inherently speculative. Forecasts relating to market conditions, returns and other performance indicators are not guaranteed and are subject to change without notice. Forecasts are based on complex calculations and formulas that contain substantial subjectivity and no express or implied prediction is made hereby with respect to TLDL, TLCL (SC), TLCS, TLDL II. There can be no assurance that market conditions will perform according to any forecast or that Tree Line Capital will achieve its objectives or that investors will receive a return of their capital. Target returns are based on a number of assumptions related to the market factors relevant to the proposed investment strategy, including, but not limited to, interest rates, supply and demand trends, and the terms and costs of debt financing. Further, past performance is not indicative of future results. Investors are cautioned not to place undue reliance on any forward-looking statements or examples included in this presentation and Tree Line Capital does not assume any obligation to update any forward-looking statements.
The information herein includes targeted yields and internal rates of returns (“IRR”), which are based on a variety of factors and assumptions and involves significant elements of subjective judgment and analysis. Targeted yields and IRRs are being presented because they provide insight into the level of risk that Tree Line Capital is likely to seek with respect to the relevant product. The targeted yields and IRRs are a measure of relative risk of a portfolio of investments, with higher targets reflecting greater risk. Targeted yields and IRRs are estimates based on a variety of assumptions regarding, among other things, current and future asset yields for such investments and projected cash flows related thereto, current and future market and economic conditions, prevailing and future interest rates, including the cost of use of leverage, where applicable, historical and future credit performance for such investments, and other factors outside of Tree Line Capital’s control. The targeted yields and IRRs are subject to uncertainties and are based upon assumptions which may prove to be invalid and may change without notice. Other foreseeable and unforeseeable events, which were not taken into account, may occur. Investors should not rely upon the targeted yields or IRRs in making an investment decision. Although Tree Line Capital believes there is a sound basis for such targets, no representations are made as to the accuracy of such targets, and there can be no assurance that such targets will be realized or achieved. Additional information concerning the assumptions used in connection with the target returns is available upon request.
To the extent specific securities are referenced herein, they have been selected by Tree Line Capital on an objective basis to illustrate the views expressed in the material. Such references do not include all material information about such securities, including risks, and are not intended to be recommendations to take any action with respect to such securities. Tree Line Capital is not responsible for any damages or losses arising from any use of this material.
This presentation is for the confidential use of only those persons, and their advisers, to whom it is transmitted by Tree Line Capital and, without the prior written consent of Tree Line Capital, may not be reproduced, distributed to others or used for any other purpose.
Copyright (c) 2020, Tree Line Capital Partners, LLC and/or its affiliates. All rights reserved.
Important footnotes
- TLDL refers to Tree Line Direct Lending, LP. TLDL is managed by Tree Line Capital (as defined below).
- TLDL (SC) refers to Tree Line Direct Lending Swiss Capital, LP. TLDL (SC) is managed by Tree Line Capital (as defined below).
- TLDL II refers to Tree Line Direct Lending II, LP. TLDL II is managed by Tree Line Capital (as defined below).
- TLCS refers to Tree Line Credit Strategies, LP. TLCS is managed by Tree Line Capital (as defined below).
- SMA refers to Tree Line Swiss Capital Debt Fund, LP. Tree Line Capital (as defined below) serves as the advisor to the SMA.
- Tree Line Funds refers to TLDL, TLDL(SC), TLDL II.
- All Funds refers to TLDL, TLDL (SC), TLDL II, TLCS and SMA.
- “SBIC Fund” refers to a formed but yet to be licensed issuer, that, if approved by the SBA, will be a SBIC under the SBA Program, will be a successor fund to SBIC I and will be managed by Tree Line Capital.
- Tree Line Capital, Tree Line, and TLCP refers to Tree Line Capital Partners, LLC.
- Portfolio FMV is defined as the cumulative fair market value of all investments by the funds managed by Tree Line Capital as determined in accordance with Tree Line Capital’s valuation policies and guidelines. These metrics reflect certain management estimates supported in certain instances by valuations performed by third-party valuation firms.
- Wtd Average Gross Unlevered YTM is defined as the expected yield, including the coupon and closing fees, of an investment that is held to maturity and payments are made as scheduled. The Gross Unlevered YTM for an equity co-investment is defined as the expected return assuming a liquidity event on the maturity date of TLCP’s loan and TLCP deal team’s forecasted EBITDA, cash, debt, and EV/EBITDA multiple on such date.
- Wtd Average Leverage is defined as the sum of (a) the product of (i) the leverage multiple for each investment [X] (calculated by dividing the most recently reported outstanding loan balance [Y] for each investment by the most recently reported LTM EBITDA for each company) and (ii) [Y], divided by (b) the total outstanding loan balance for the entire portfolio of investments held by All Funds.
- Wtd Average Fixed Charge Coverage is defined as the sum of (a) the product of (i) the LTM fixed charge coverage multiple for each investment [X] (calculated by dividing (x) the trailing twelve months’ EBITDA less the sum of trailing twelve months’ unfinanced capital expenditures, cash tax payments, and other permitted distributions and/or restricted payments by (y) the trailing twelve months’ cash interest payments and mandatory debt repayments) and (ii) the outstanding loan balance [Y] for the entire portfolio of investments held by All Funds.
- total Return to Date is defined as the cumulative cash inflow related to each specific investment by each specific Fund up to the referenced point in time noted in each respective table. Returns are shown for specific investments. There can be no guarantee that any target return or any other fund objectives will be realized. It should not be assumed that any investment will be realized at projections shown or will be profitable. Actual results will vary and may differ materially from the target return. Returns to investors from a Fund will aggregate returns from all the respective Fund’s investments and will be reduced by fund-level fees, including asset management fees and incentive distributions, and investor-level taxes, all of which reduce returns to investors.
- Wtd Average Unlevered Gross Cash Yield is defined as the sum of (a) the product of [X] the sum of for each respective investment (i) the effective margin over base rate at close, (ii) the effective base rate at close, (iii) any annual administrative fee divided by the outstanding principal balance, and (iv) any closing fee expressed as a percentage of the outstanding principal balance divided by the tenor of the investment, and (b) the principal balance outstanding [Y] for each respective investment made during the time period referenced. Note: Wtd Average Unlevered Gross Yield does not include common equity or like investments in the calculation of outstanding principal.
- Intentionally Omitted.
- Average values are shown for LTM Revenue and LTM EBITDA. LTM financial data as of most recently reported period. Weighted average calculations do not include fund guaranty loans as borrower level financial information is not indicative of the loan’s performance due to the loan relying primarily on the support from the institutional fund owner of the borrower via a guaranty agreement rather than the cash flow and enterprise value of the individual borrower. LTM Leverage weighted average calculation also excludes equity investments.
- “Realized Gross IRR” figures are used herein instead of “Net Realized IRR” as a “Net Realized IRR” cannot be reasonably calculated on a per investment basis or a discreet group of investments. “Realized Gross IRR” and “Realized Gross MOIC” figures are calculated before giving effect to fund-level expenses, management fees and carried interest, which reduce returns to investors. The “Realized Gross IRR” figures are gross internal rates of return, meaning aggregate, compounded, annual gross rates of return on investments, calculated on a monthly basis. “Realized Gross MOIC” is the ratio of the realized proceeds from the applicable investment to the aggregate amount invested by a Fund in such portfolio company. “Realized Gross IRR” and “Realized Gross MOIC” are calculated before taxes to investors. There can be no assurance that the past performance of the Funds and its investments will be replicated or that any future investments of the Funds will have performance attributes comparable to the investments described herein. Past performance is not indicative of future results.
- The S&P/LSTA U.S. Leveraged Loan 100 Index (“LLI”) is designed to reflect the performance of the 100 largest actively traded loan facilities in the leveraged loan market. Data sourced directly from Standard & Poors at spglobal.com.
- The S&P 500 Bond Index is designed to be a corporate-bond counterpart to the S&P 500, which is widely regarded as the best single gauge of large-cap U.S. equities. Market value-weighted, the index seeks to measure the performance of U.S. corporate debt issued by constituents in the iconic S&P 500.
- Cliffwater LLC “2020 Q1 Report on U.S. Direct Lending”. The Cliffwater Direct Lending Index (the “CDLI”) is an asset-weighted index of over 6,000 directly originated middle market loans totaling $115 billion in assets as of March 31, 2020. The CDLI seeks to measure the unlevered, gross of fees performance of U.S. middle market corporate loans, as represented by the underlying assets of Business Development Companies (“BDCs”), including both exchange-traded and unlisted BDCs, subject to certain eligibility requirements. The CDLI is asset-weighted by reported fair value. Other industry participants may make different determinations regarding the focus of these BDC portfolios.
- “BDC” refers to publicly traded Business Development Companies, as defined by the amended Investment Company Act of 1940. All data points relating to BDCs herein are sourced from public SEC disclosures accessed via the online EDGAR platform.
- S&P Global Market Intelligence Leveraged Commentary and Data
- Refinitiv LPC Loan Connector Q1 2020
- Sourced from Wells Fargo Leveraged Loan Research as referenced in Grant’s Interest Rate Observer: Almost Daily Grant’s (July 9, 2020: The Hunter Gets Captured by the Game)
- Moody’s Investor Service Q1 2020 Leveraged Loan Report on Covenants and Recoveries, as referenced in Bloomberg on May 4, 2020.
- Dow Jones Industrial Average (The Dow) referenced herein as “DJIA” is a registered trademark of S&P Global. DJIA is a price-weighted index of 30 U.S. blue-chip companies covering all industries except transportation and utilities. Data sourced directly from Standard & Poors at spglobal.com.

