
An in-depth look at the lower middle market
the
ASCEND
REPORT
Summer 2020
EXECUTIVE SUMMARY
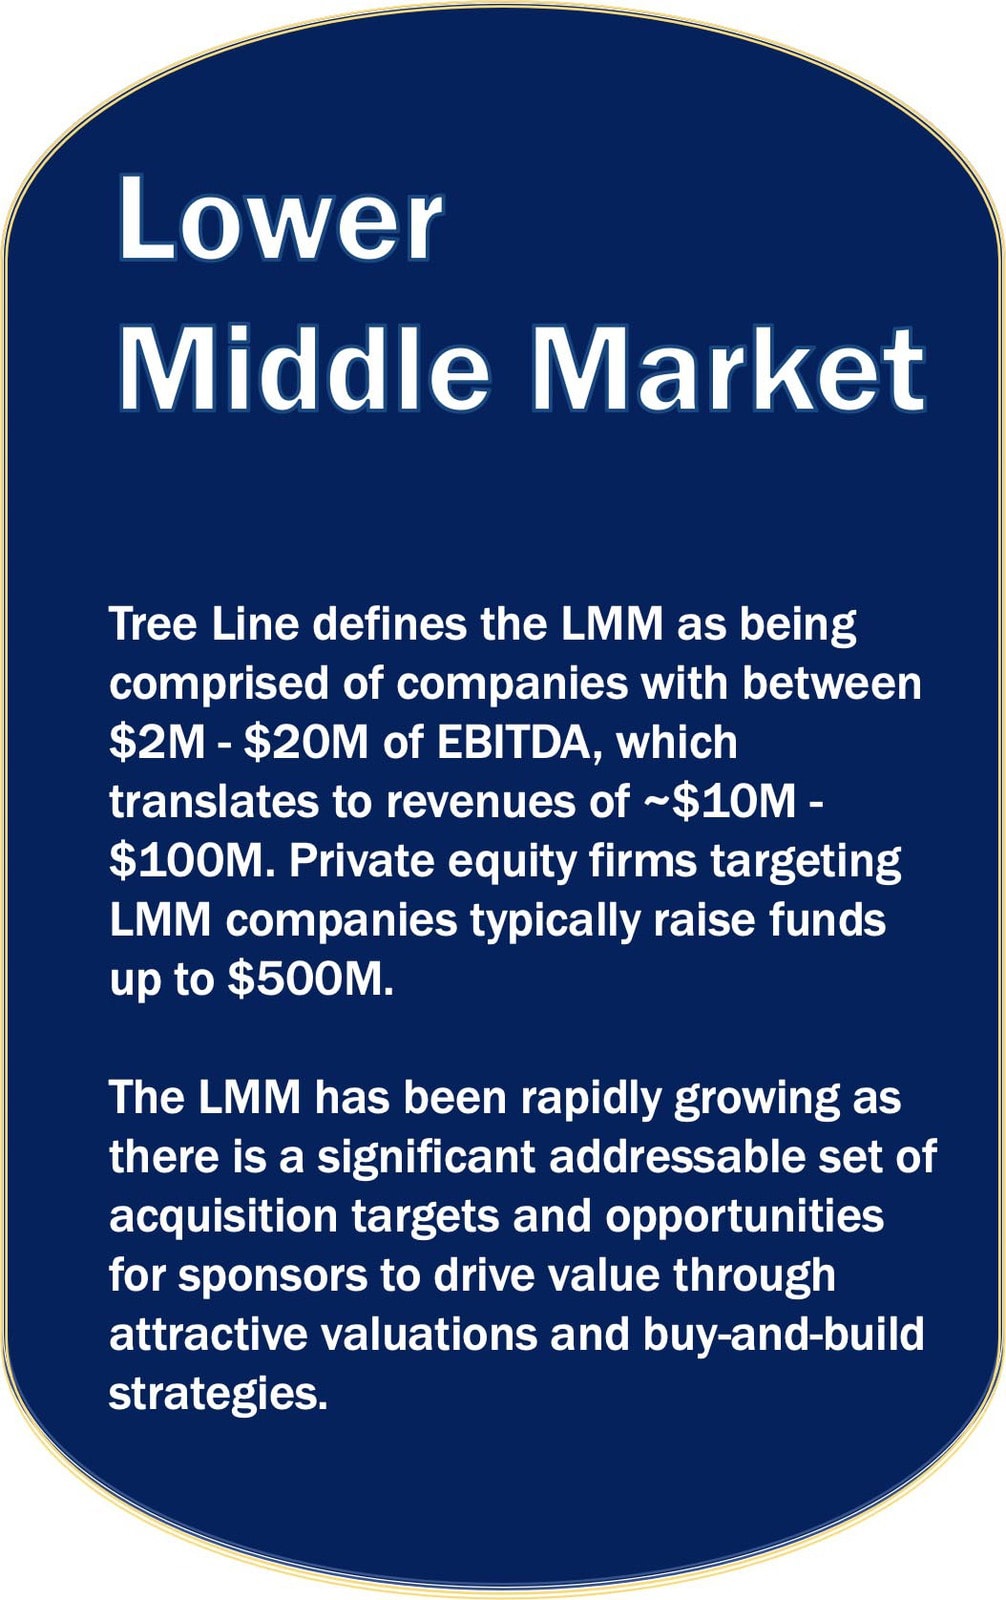
Tree Line is pleased to present the first annual Ascend Report, which provides insight into the state of the lower middle market (“LMM”). We begin by providing a broad overview of the LMM, including market sizing statistics, historical growth and commentary regarding the proliferation of sophisticated private equity sponsors that have entered the LMM. Managers have proven buy and build platforms can successfully capture multiple arbitrage which has heightened attention to the LMM opportunity set. As a result, many firms have been launched in the LMM by seasoned private equity professionals from reputable, middle market sponsors, which has brought a level of sophistication to the LMM that did not previously exist. Adding to the market’s sophistication is emergence of data-driven analysis helped by various new research platforms which provide for insightful takeaways on sector performance.
Following the market overview, we provide a summary of the survey of 60 LMM private equity managers recently conducted by the Tree Line team. Managers provided feedback on deal activity, deployment expectations and sector focus. Overwhelmingly, participants noted robust activity expectations over the next 12 months with certain identified shifts in investment strategy. The data from the Ascend Survey is extremely valuable and we are grateful to our sponsor relationships for participating.
We conclude the Ascend Report with a summary of how the examined trends within the LMM have influenced Tree Line’s own investment outlook. We discuss our own findings in historical borrower sizing, valuations, use of add-on financing and sector focus. 2020 will prove to be a defining year for all investors in the LMM. Despite today’s challenges, we believe we are entering one of the most attractive investment vintages on record. Now more than ever, market awareness and data are paramount to portfolio construction. We will continue to mine our data set of thousands reviewed opportunities for critical perspectives for the benefit of our investors, borrowers and private equity partners.
Tree Line Contributing Team
THE LOWER MIDDLE MARKET

Buy and Builds Driving Activity
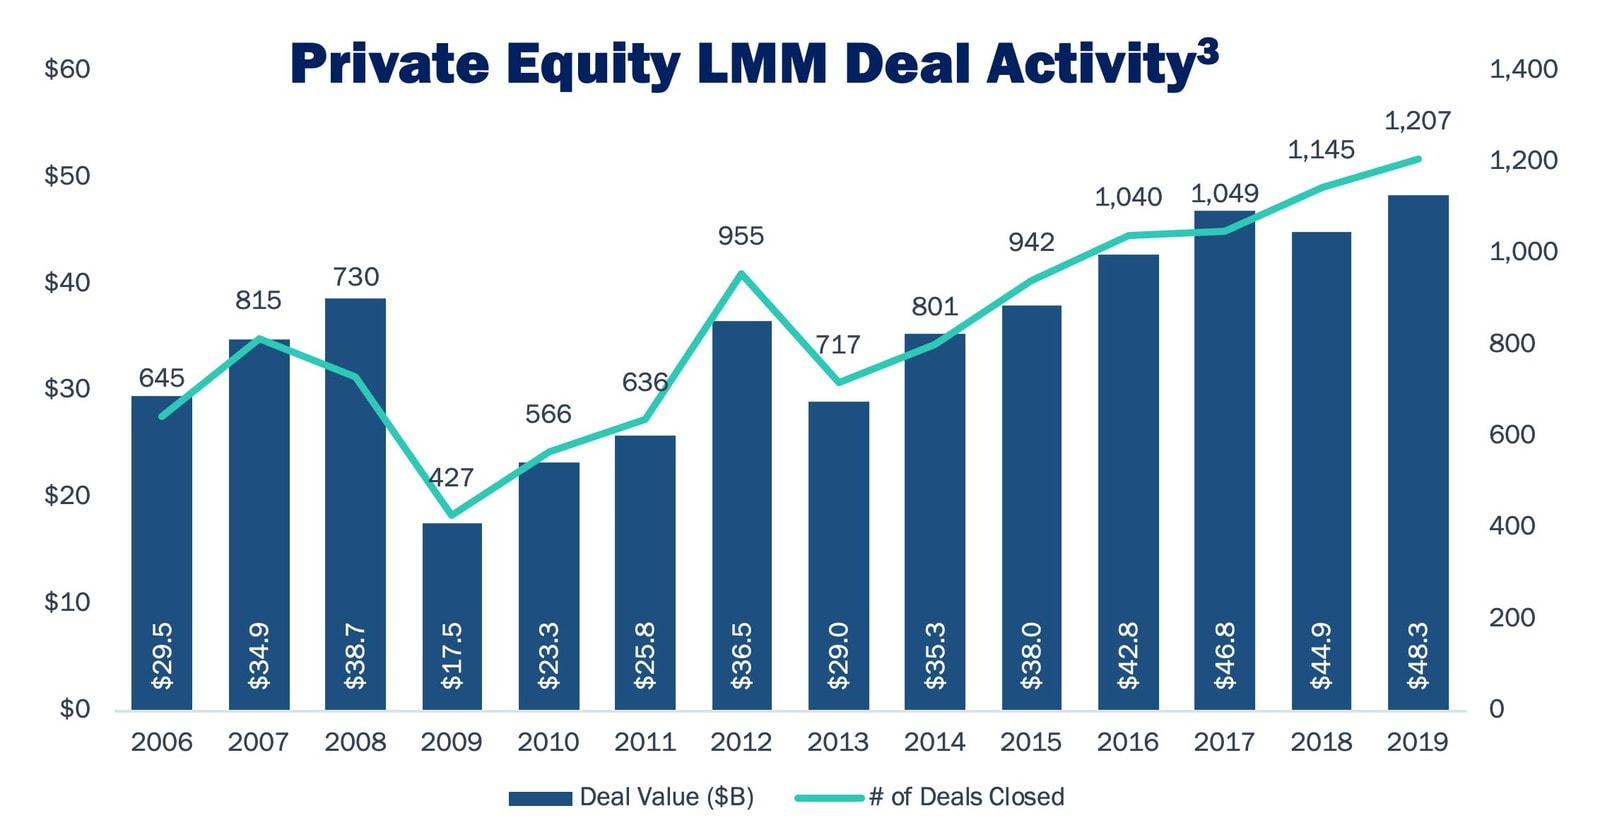
Add-on acquisitions are core to the buy and build thesis which have driven significant activity in the lower middle market
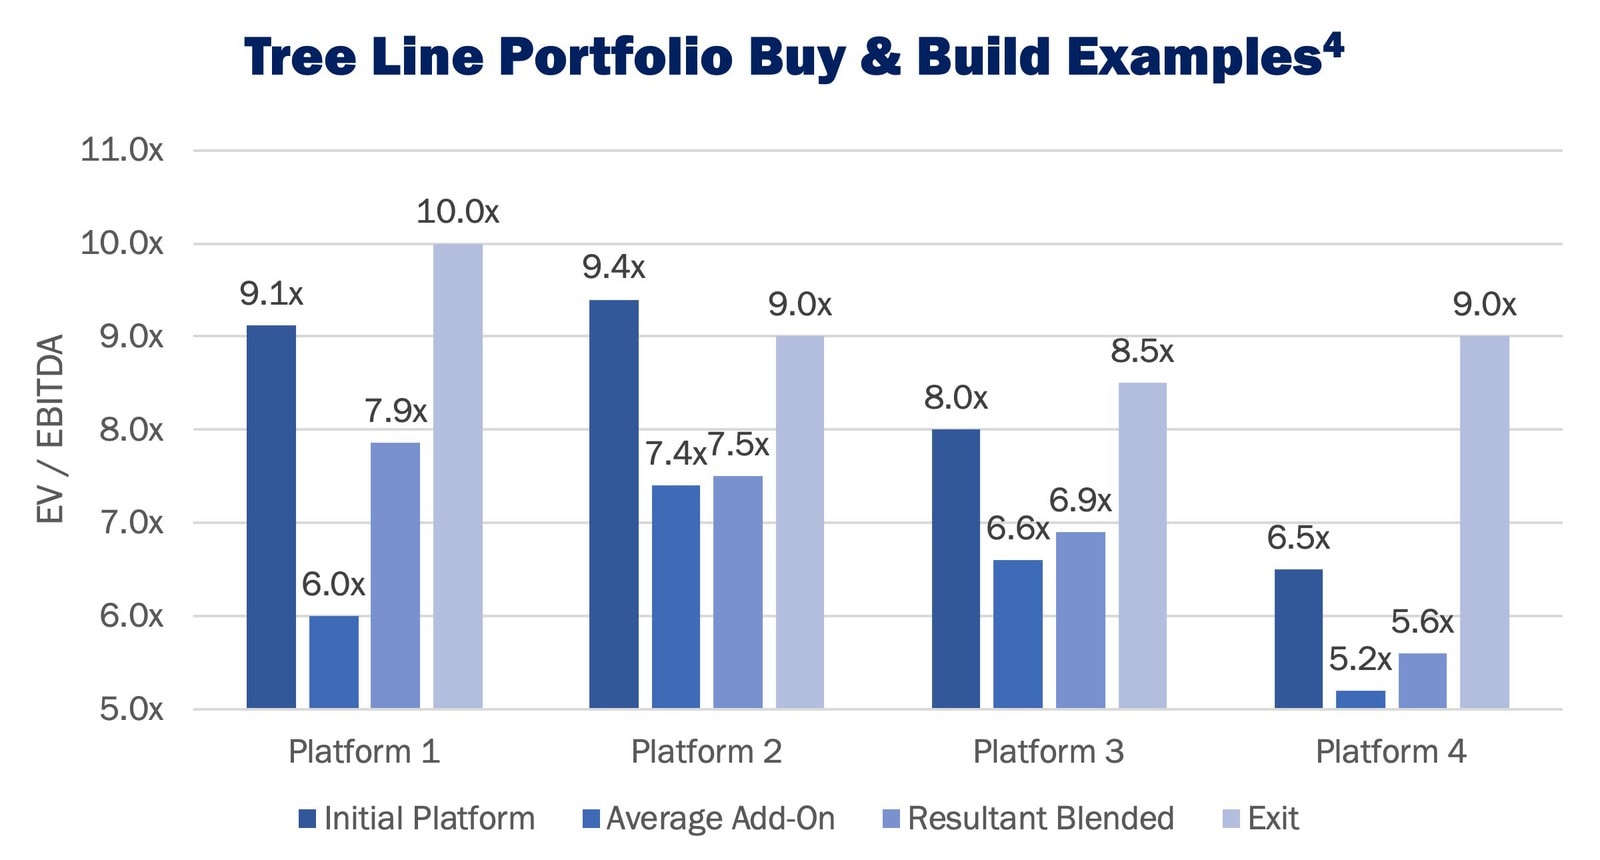
Buy and Builds within Tree Line’s portfolio have generated ~2x multiple expansion for LMM sponsors
LMM Sponsor Growth from Spin-outs
Seasoned private equity professionals have departed upper middle market and middle market private equity funds to form lower middle market spin-offs, bringing a level of sophistication to the lower middle market that previously did not exist. Since 2017, over 50 such firms have launched. These LMM firms have raised unprecedented amounts of capital5.
Over the past five years, private equity firms with fund sizes of $50M – $500M have raised over $155B6.
Sector Performance Database
In addition to the increasing presence of experienced large-market sponsors now transacting in the LMM, the LMM’s overall sophistication has improved driven by availability of data.
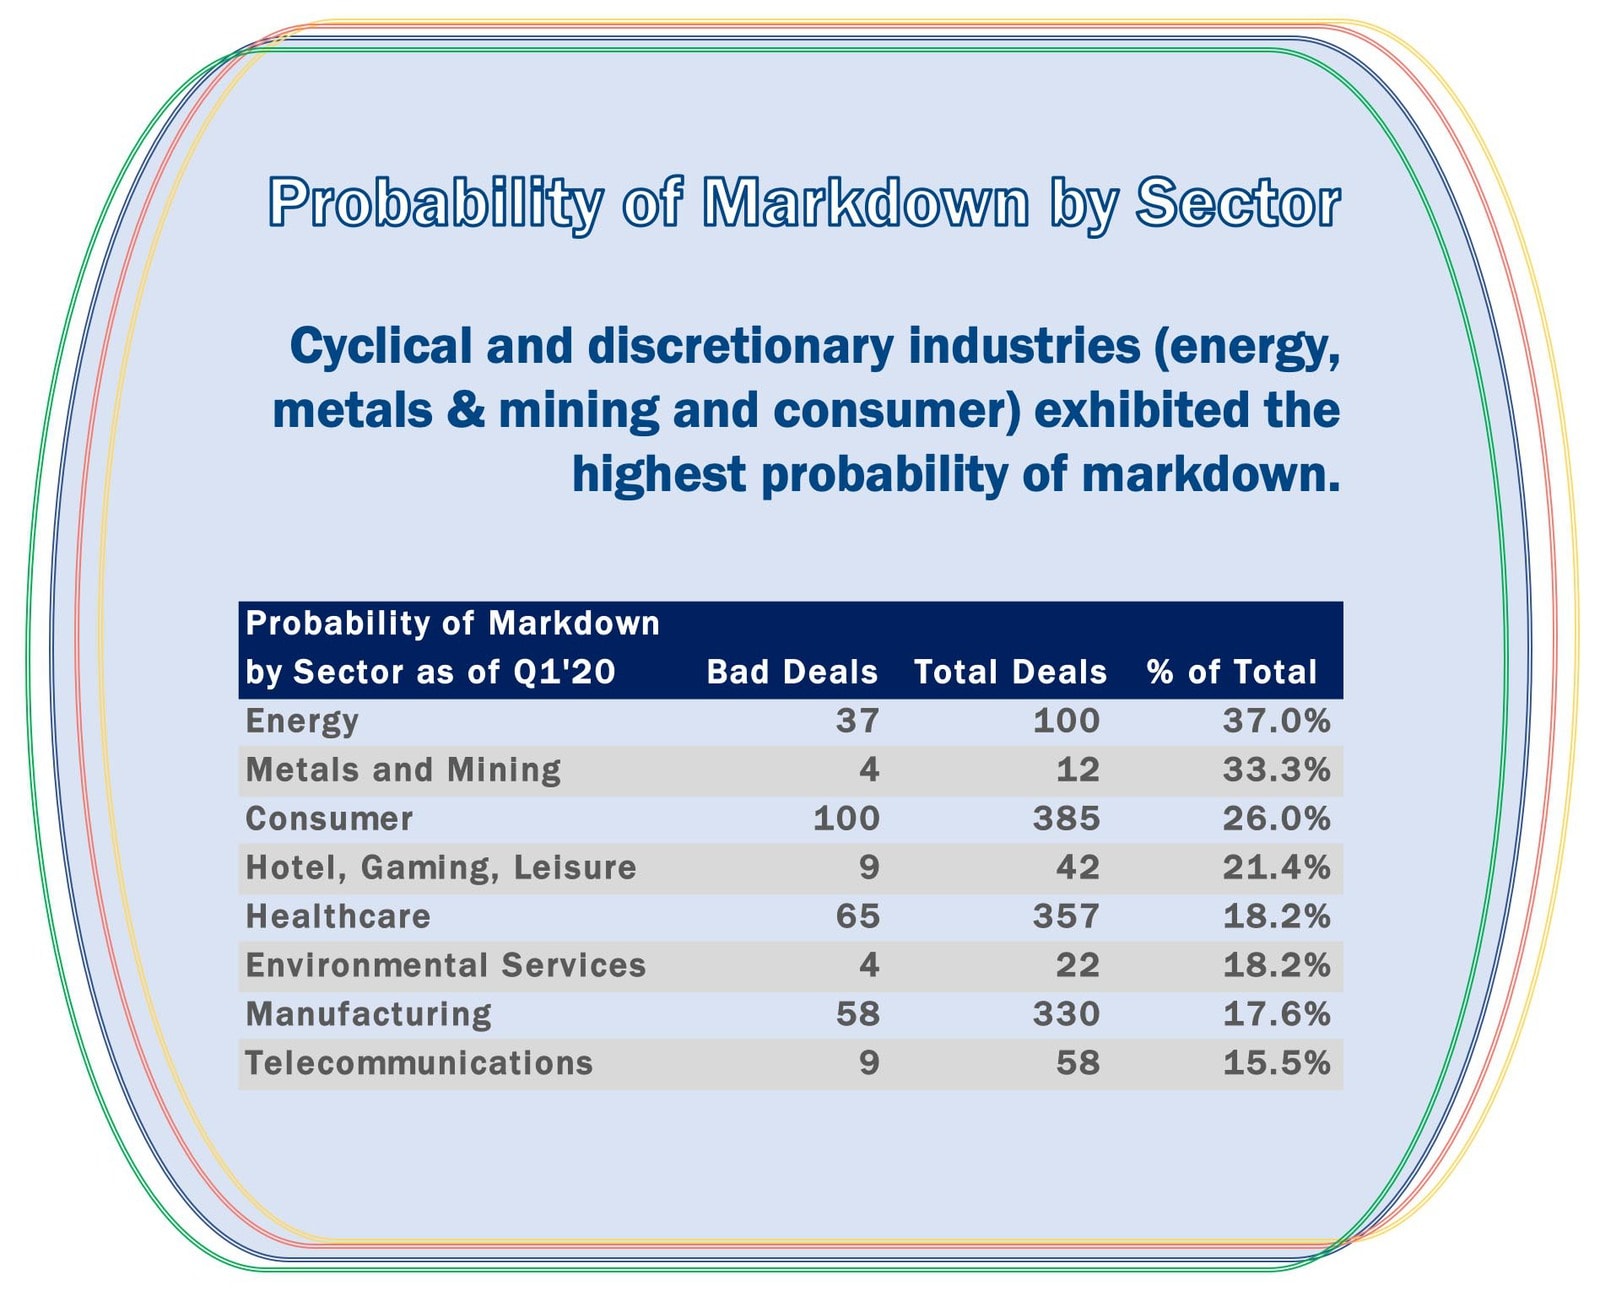
Tree Line maintains a database of > 1,000 borrowers from public BDC filings to monitor the probability of default by sector.
Sector: Consumer
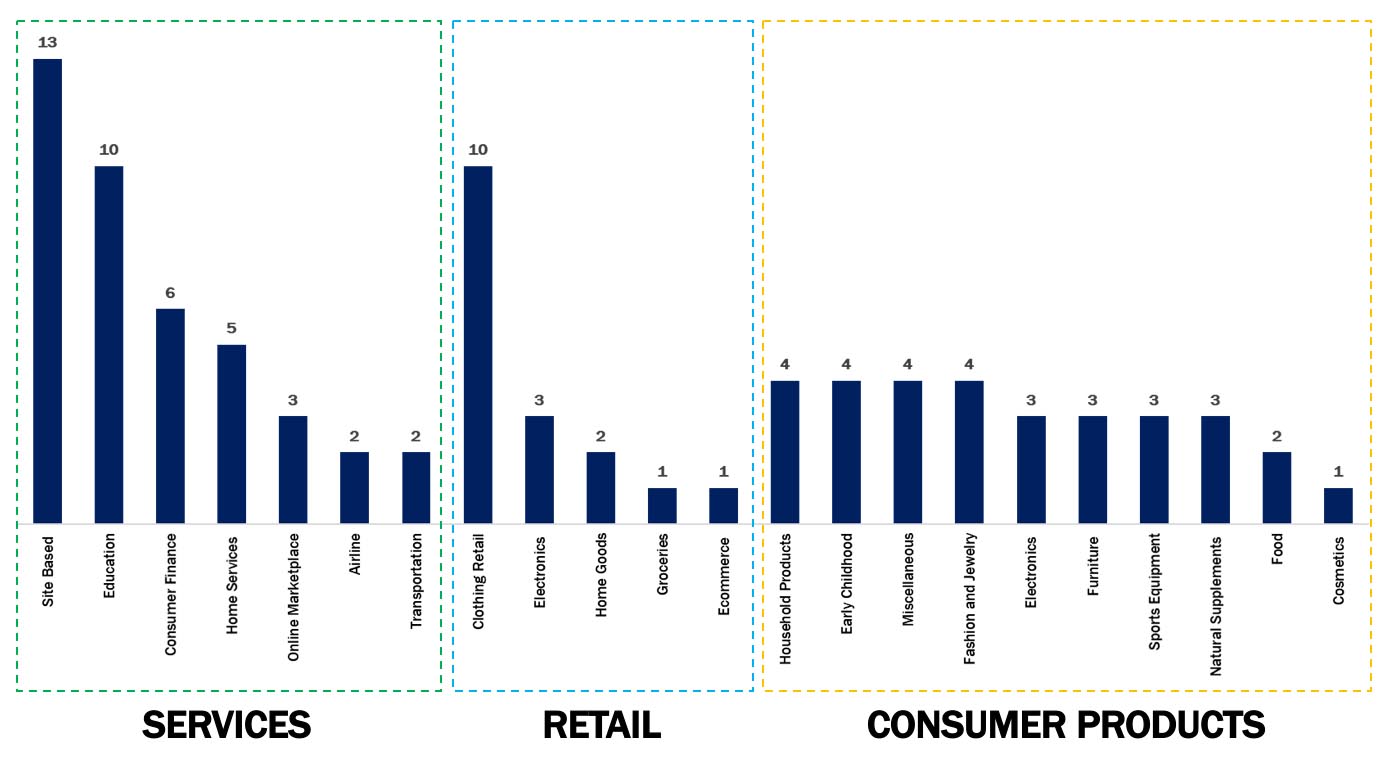
- Site-based (12 fast food / fast casual Restaurants and 1 gym) comprised the largest sub-sector of consumer at 13% of total consumer deals. Site-based reported an average mark (FMV/Cost) of 26%.
- Clothing retail, representing 10% of consumer, was the second worst performing sub-sector of consumer with an average mark of 36%. Overall retail comprised 22% of consumer and had an average mark of 47%.
- Of the 10 education deals, 5 were Higher Education and 4 were Online Education. Education deals had an average mark of 17%.
Sector: Healthcare
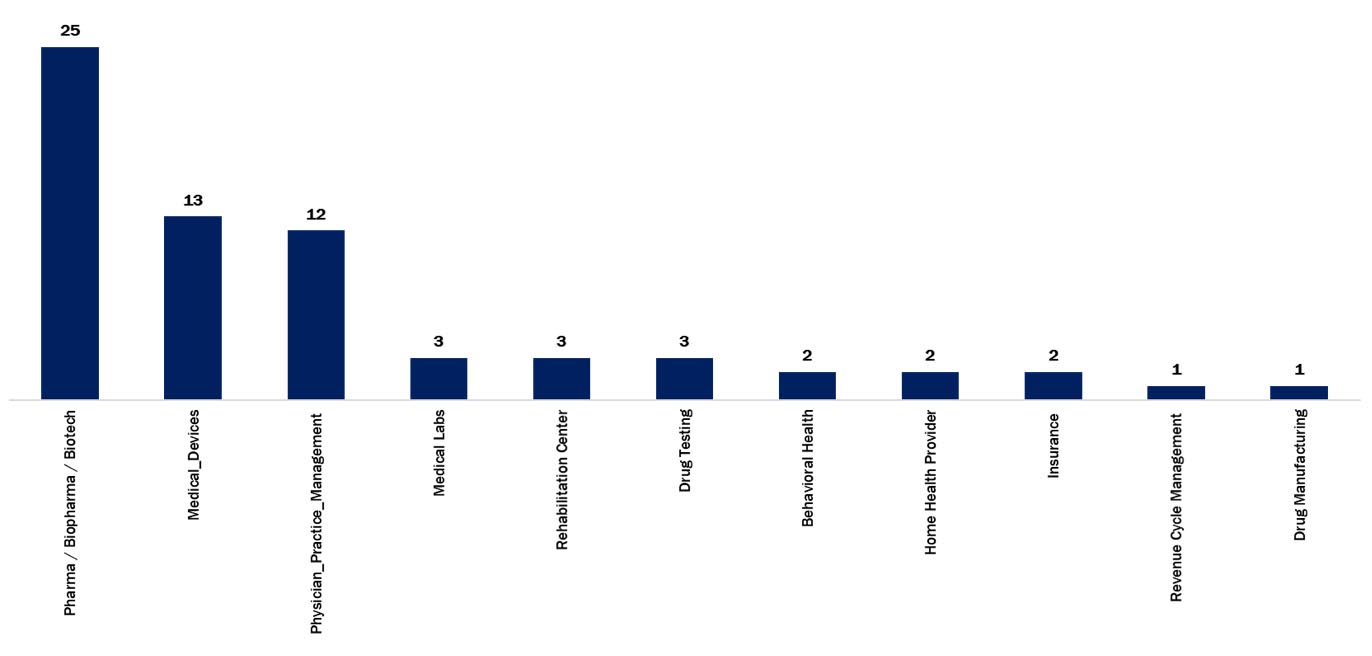
- Pharma and biotech was the largest sub-sector in healthcare, reporting 25 bad deals or 38% of the category. 72% of these were equity deals with relatively small nominal dollars of amortized cost (<$3M). Deals in the space had an average mark of 38%.
- Medical device companies (primarily instrumentation vs. durable medical equipment) represented a meaningful portion of healthcare deals as well at an average mark of 63%.
- Of the 12 deals in the Physician Practice Management (“PPM”) space, 4 were dental deals with an average mark of 58%. The sub-sector also included two dermatology deals and two hospital deals.
Sector: Manufacturing
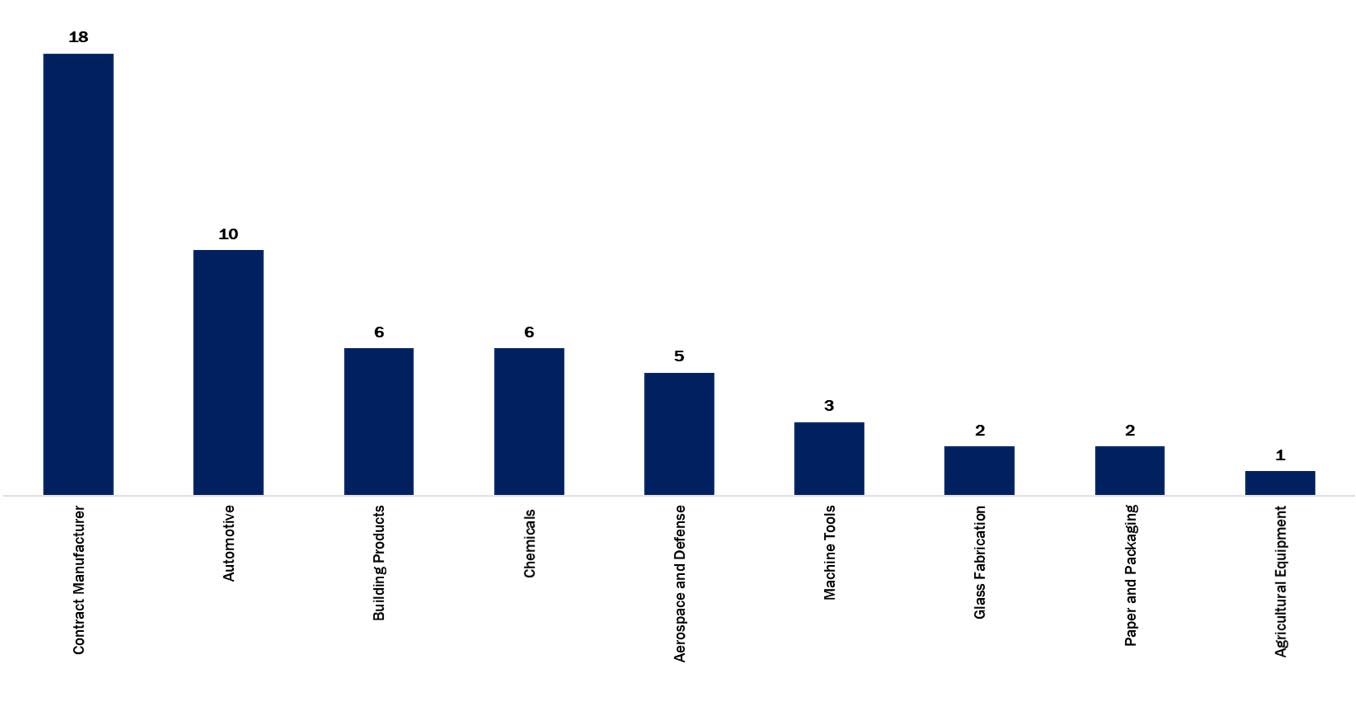
- Contract manufacturers serving a broad range of end markets were the largest contributor in the broader manufacturing category. The average mark for these deals was 47%.
- Automotive comprised the second largest category within Manufacturing at 10 deals and had an average mark of 61%.
BDCs Sidelined
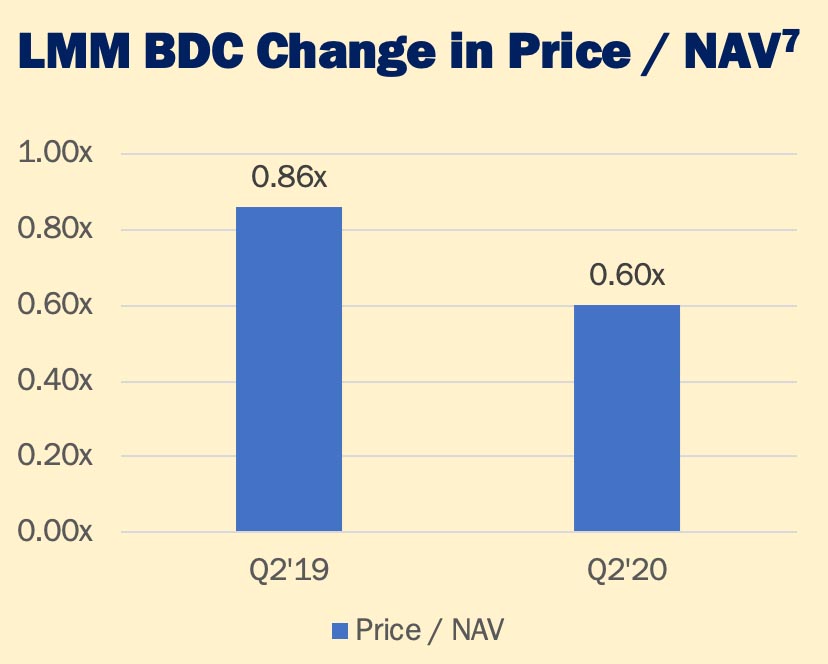
Valuation and performance issues at LMM BDC managers driven by COVID has shifted industry valuations well below NAV, limiting future equity issuance.
Dislocation Impact
COVID exposed many lenders carrying too much risk via elevated leverage with weak documentation in cov-lite deals, or too little liquidity driven by poor management of unfunded commitments. This dislocation has created a significant opportunity for healthy lenders with available capital.
2020 ASCEND SURVEY

60 PRIVATE EQUITY SPONSORS CONTRIBUTED THE FINDINGS OF THE FIRST ANNUAL ASCEND SURVEY.
What type of economic recovery are you projecting?
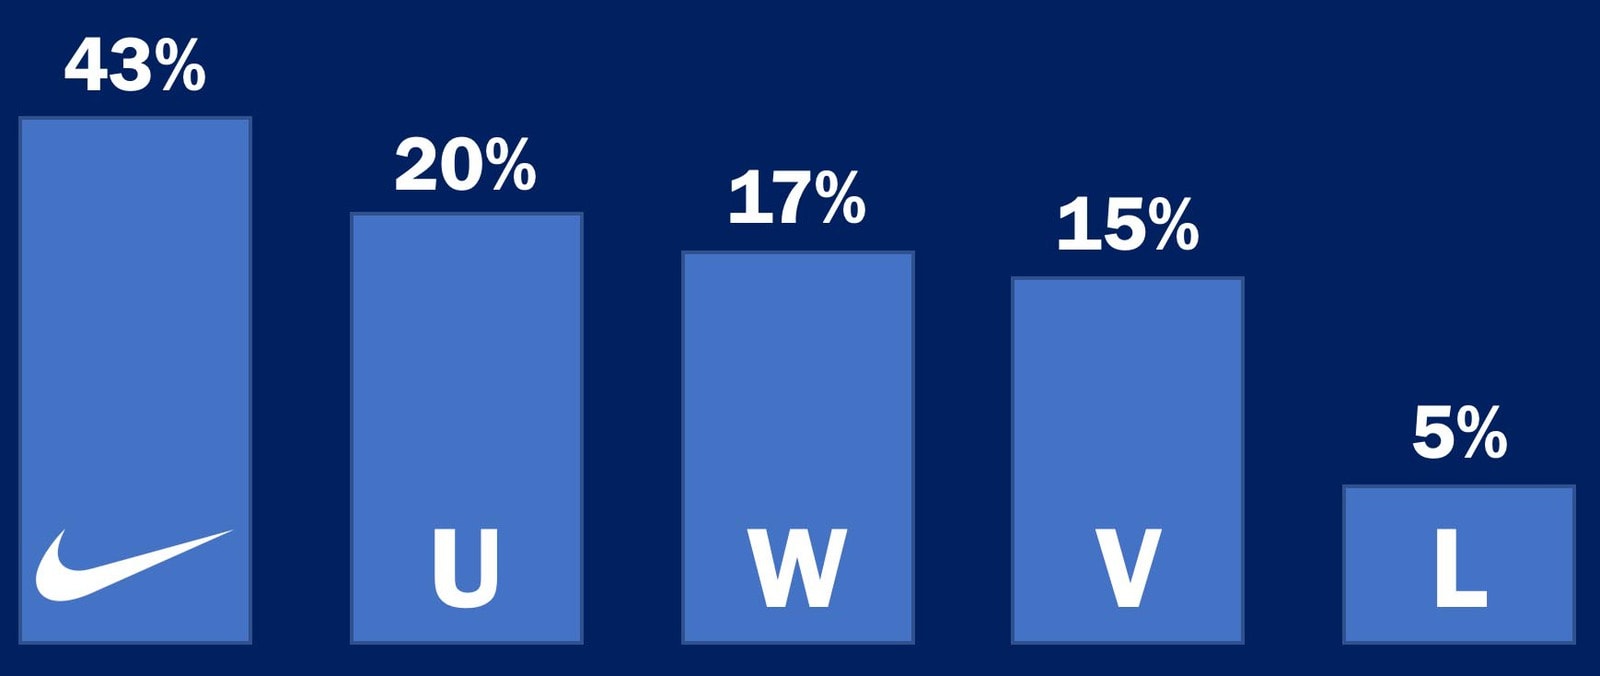
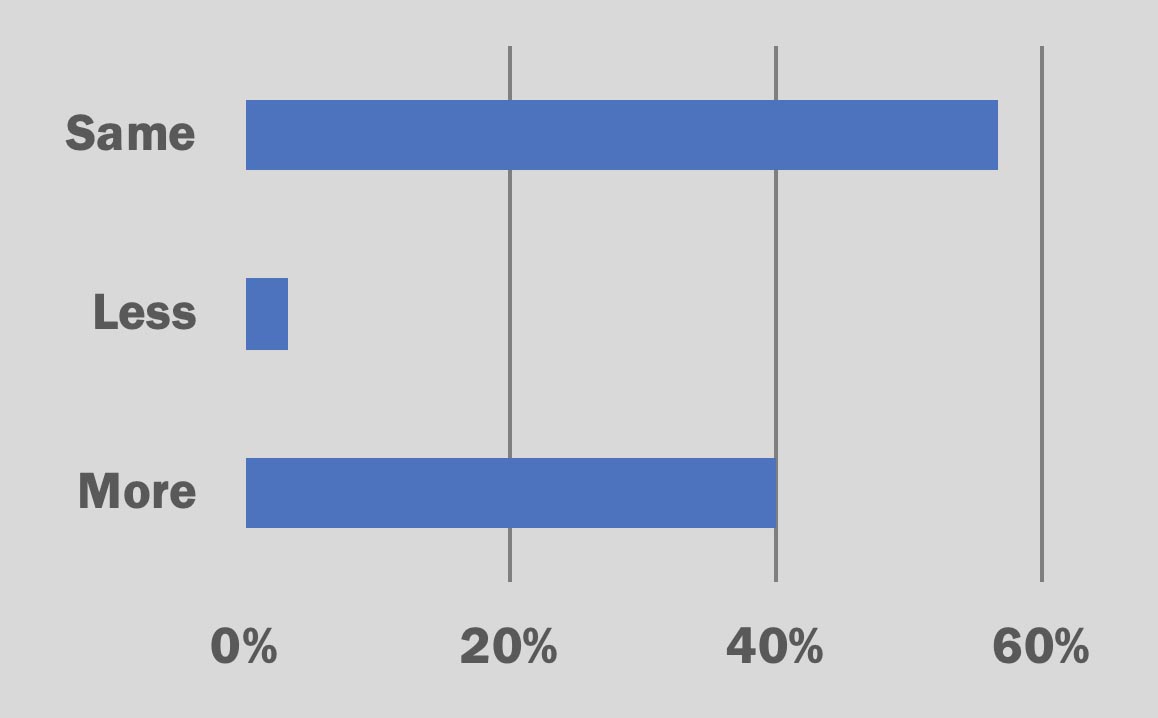
Do you expect to deploy more, less or the same amount of capital in the next 12 months compared to previous plans?
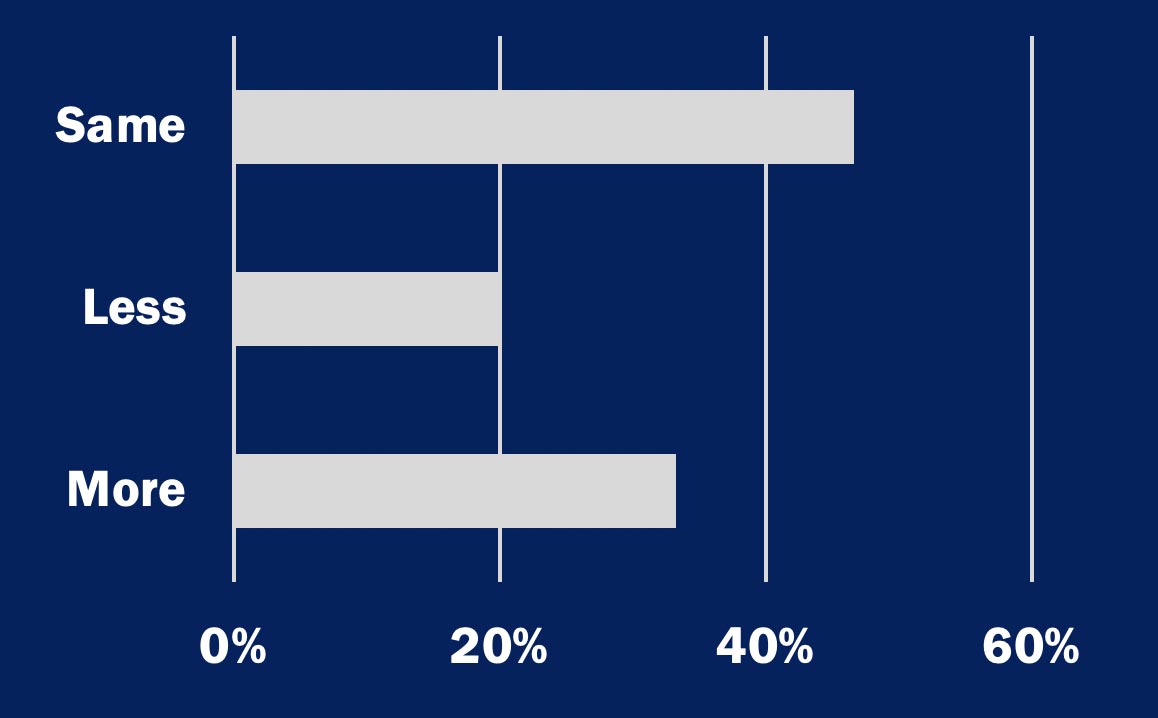
Do you expect more, less or the same amount of capital to be allocated to add-ons?
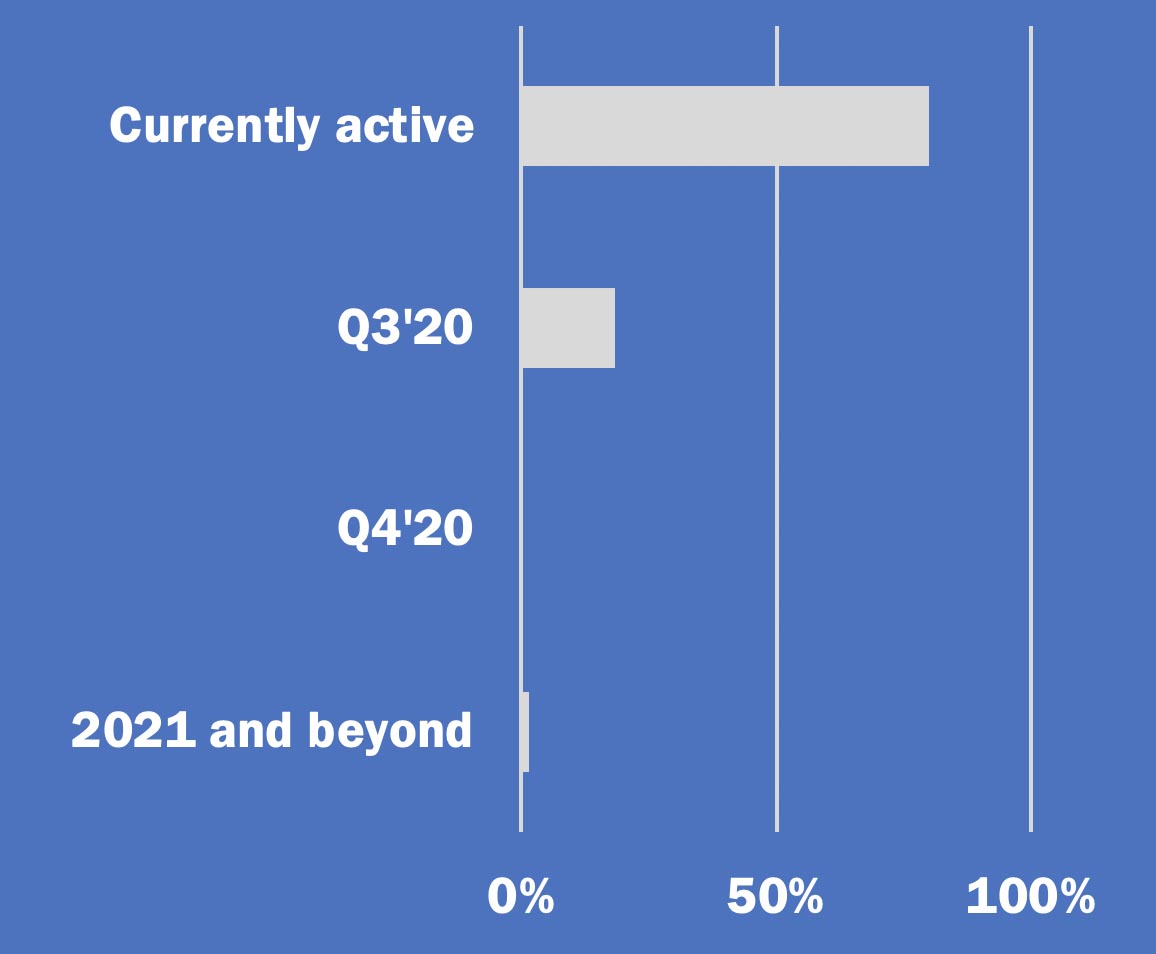
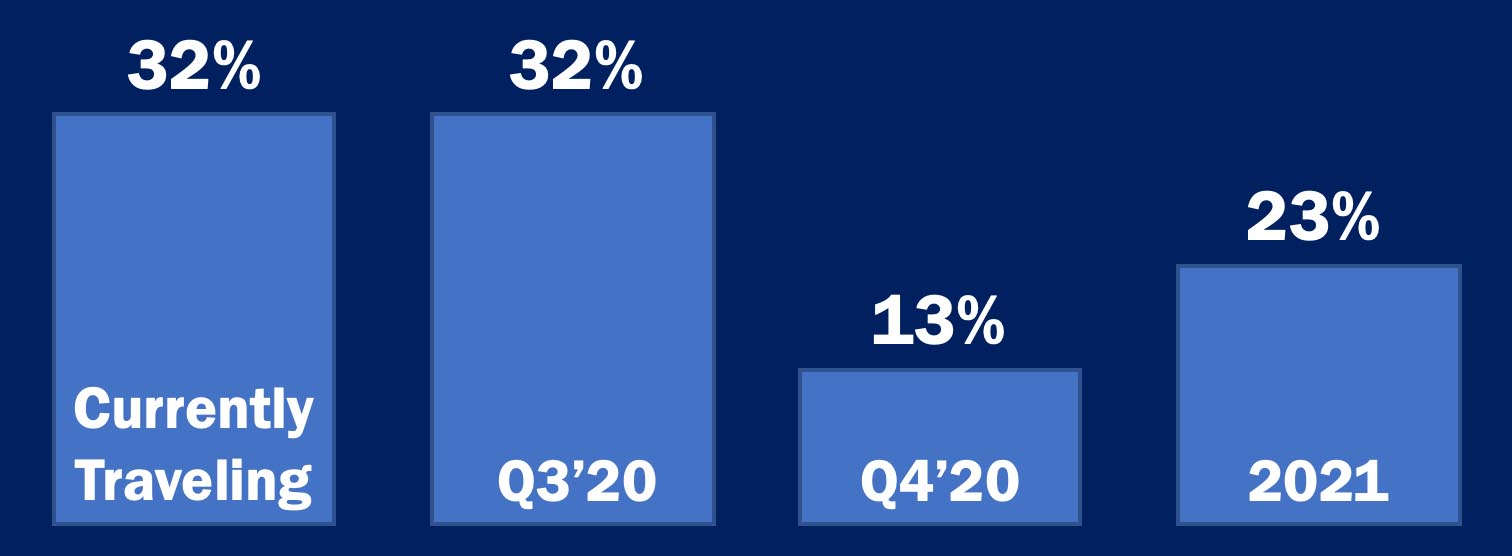
When do you expect new platform acquisition activity to continue?
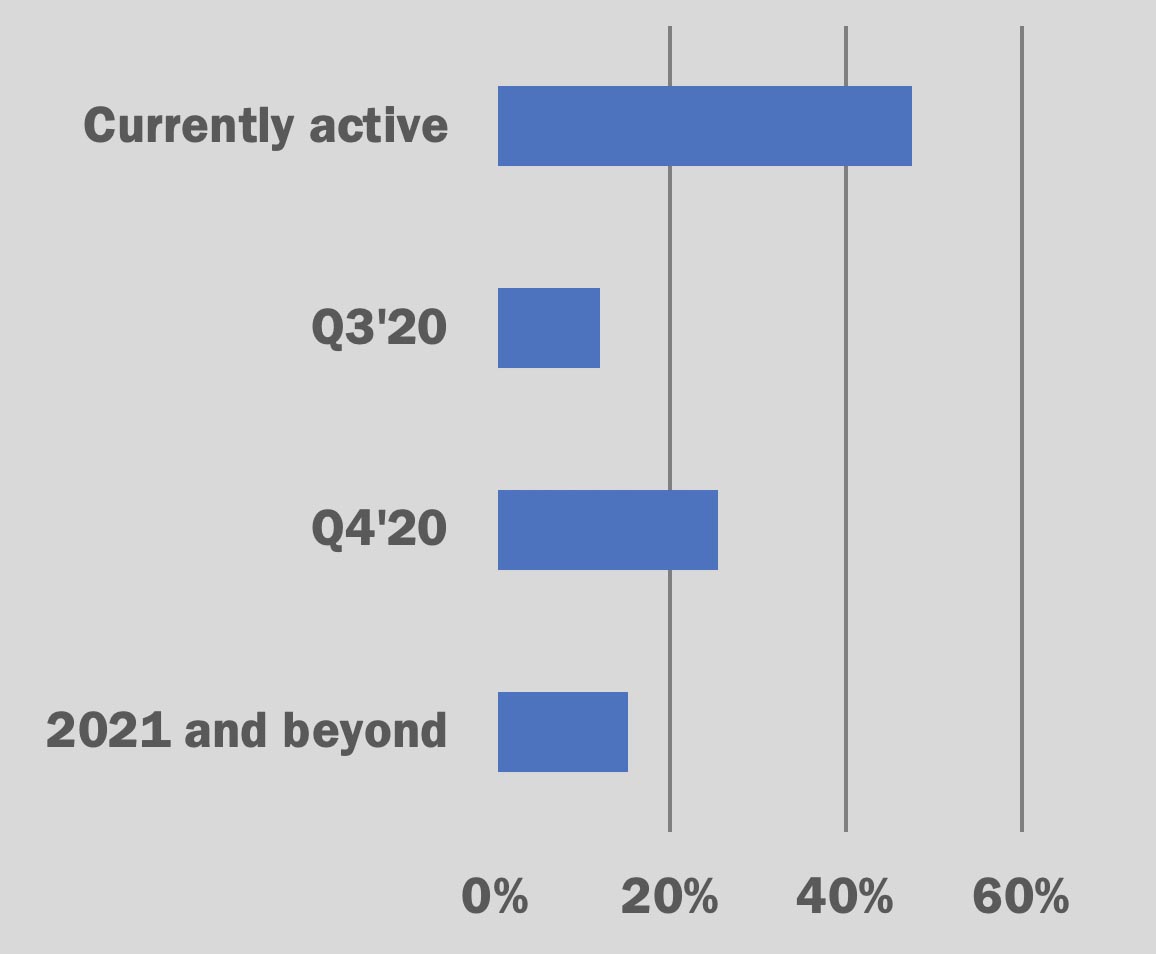
When do you expect add-on acquisition activity to continue?
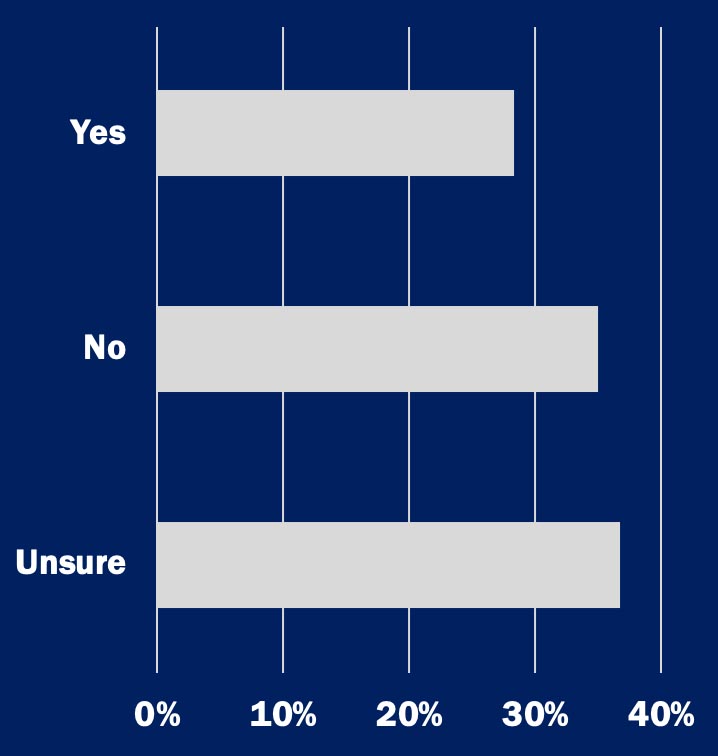
Will you invest in businesses that could be impacted by a second wave or future shelter in place mandates?

Will you seek distressed opportunities post-COVID-19?
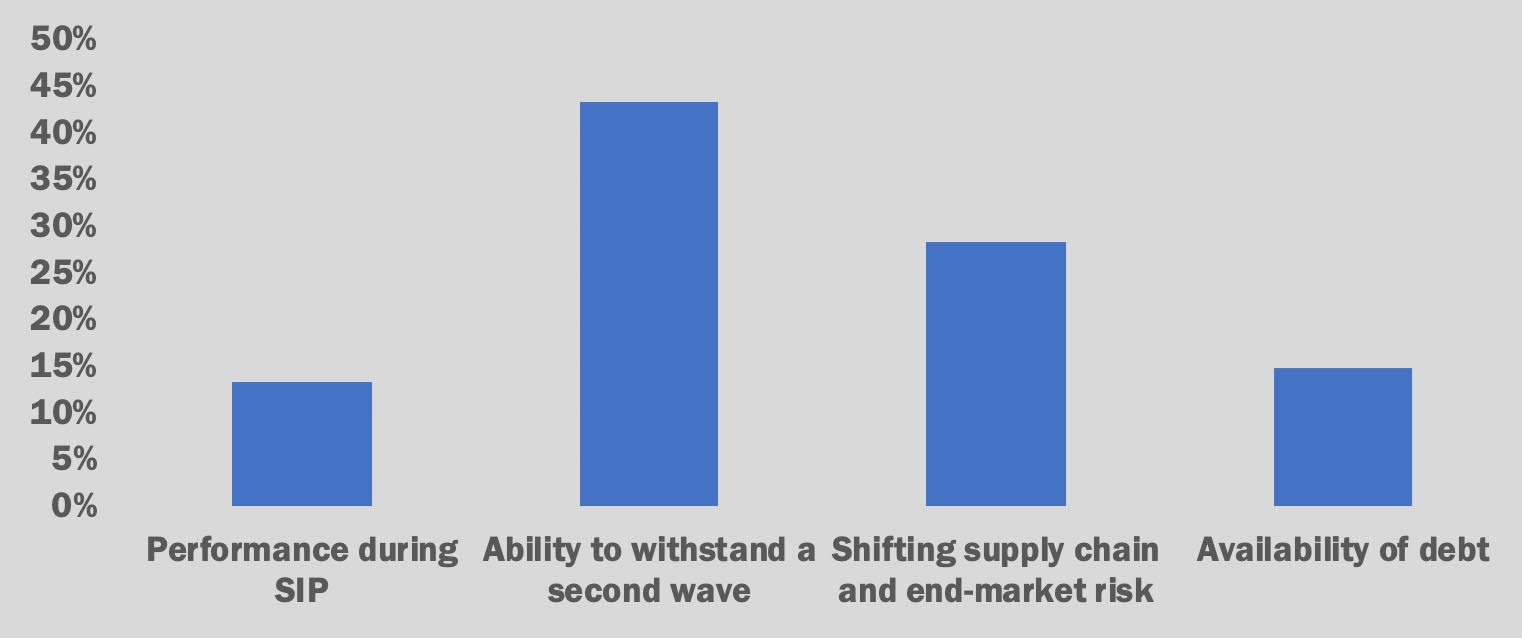
What is your top concern in the current environment for a new platform?
Do you expect your target market of opportunities will expand, shrink or remain the same?
- Expand: 45%
- Shrink: 30%
- Remain the Same: 25%
Other than industries materially impacted by COVID-19 or a recession, do you expect EV multiples to increase, decrease or remain the same?
- Expand: 10%
- Shrink: 45%
- Remain the Same: 45%
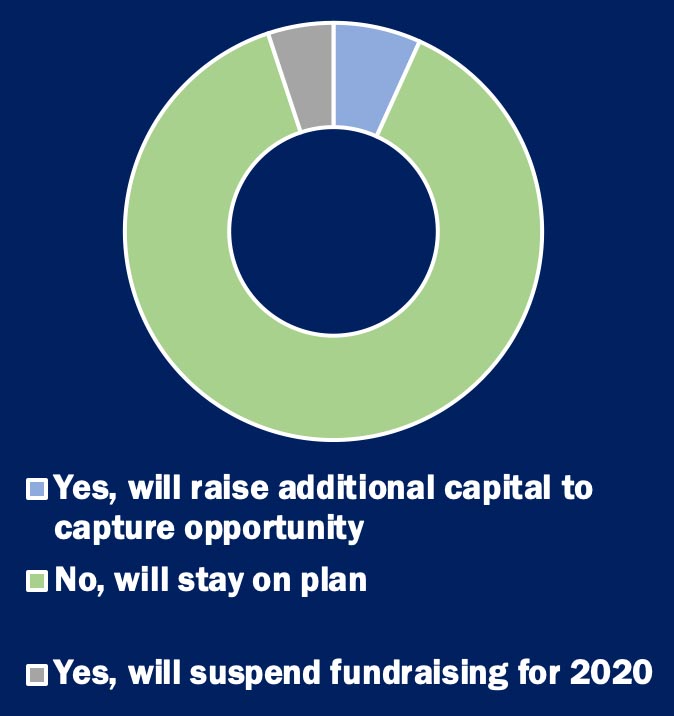
Will your fundraising plans change as a result of COVID-19?
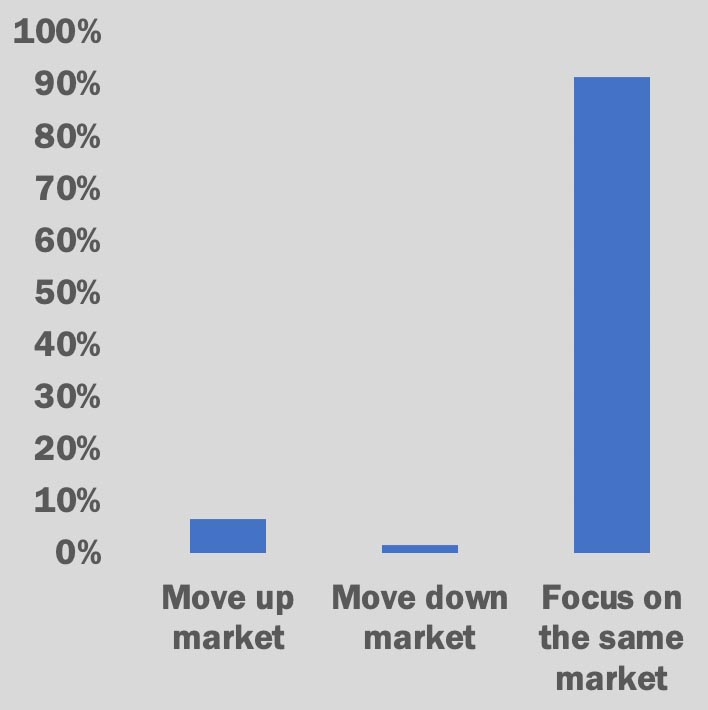
Do you expect to move up market, down market or remain focused on the same market?
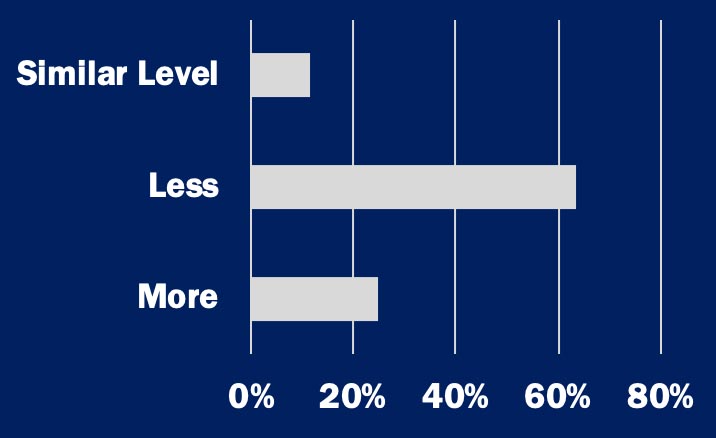
Over the next 12 months, do you expect LMM M&A activity (companies with <$15M of EBITDA) to be more or less active compared to the prior 12 months?
Sponsors noted their process and strategy is expected to shift as a result of COVID…
93% expect video conferencing to play a bigger role in their diligence efforts
90% expect video conferencing play a bigger role in their portfolio management efforts
25% expect their investment strategy shift to focus on companies that have the ability to work remotely
5% expect their geographic focus change due to potential travel challenges
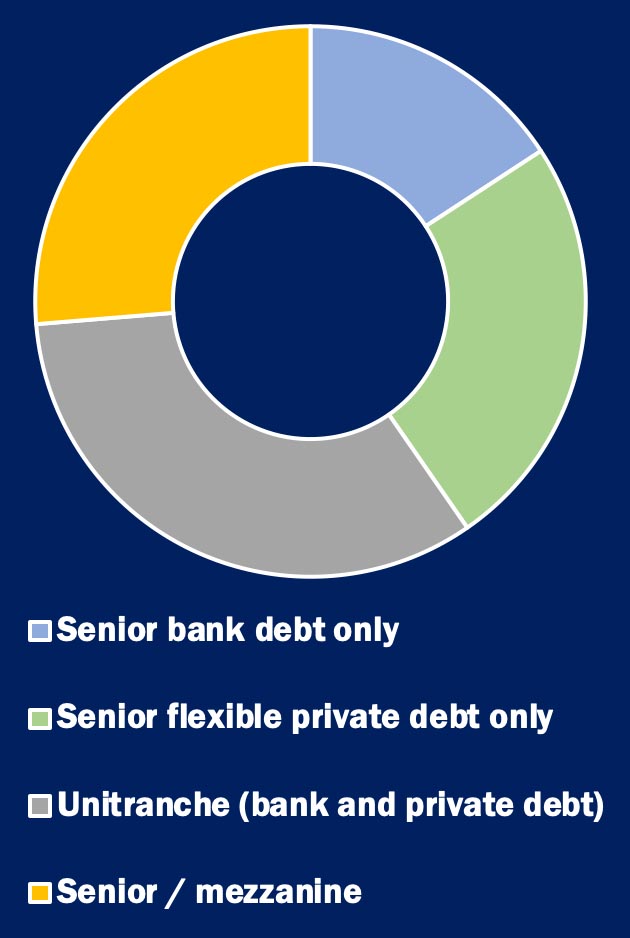
What is your preferred debt structure?
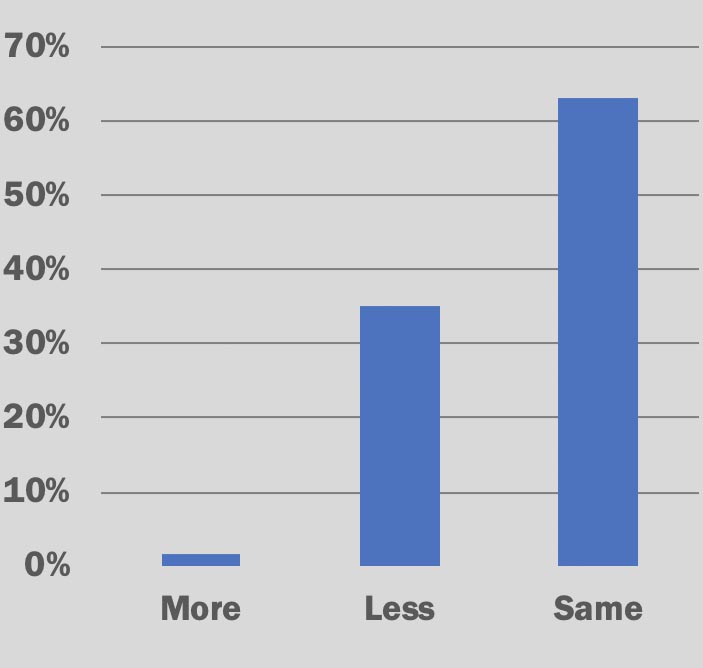
Post-COVID-19, do you expect to use more, less or the same amount of leverage?
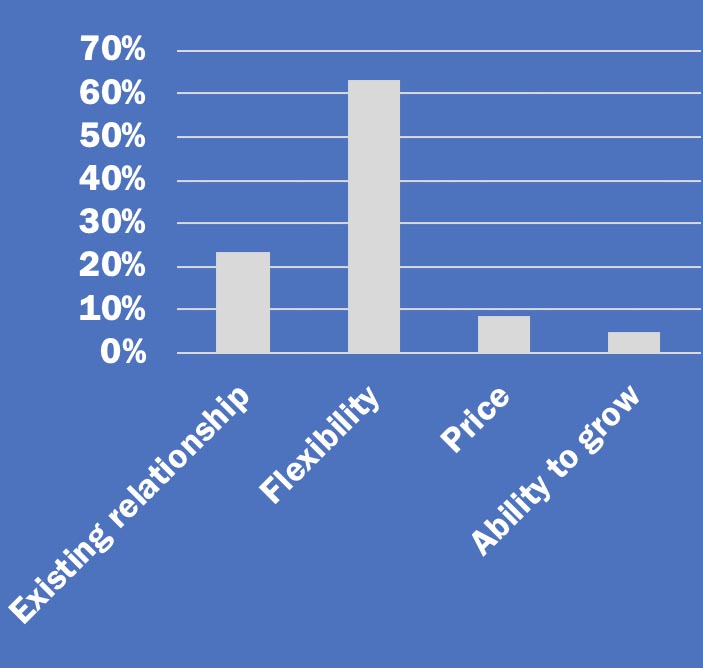
Rank the most important factor when selecting a lender:
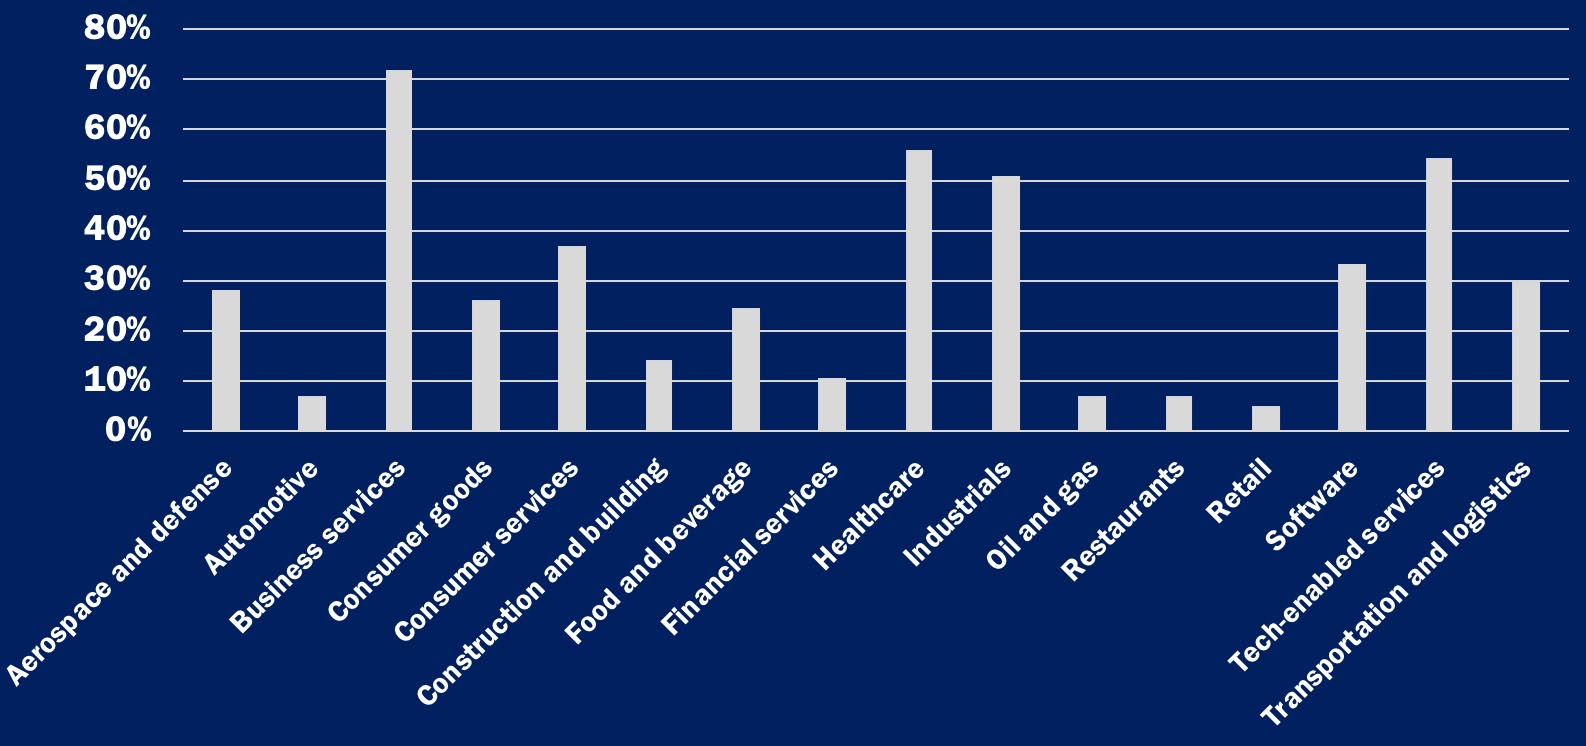
Targeted industries pre-COVID-19 (% of respondents that focus on each sector):
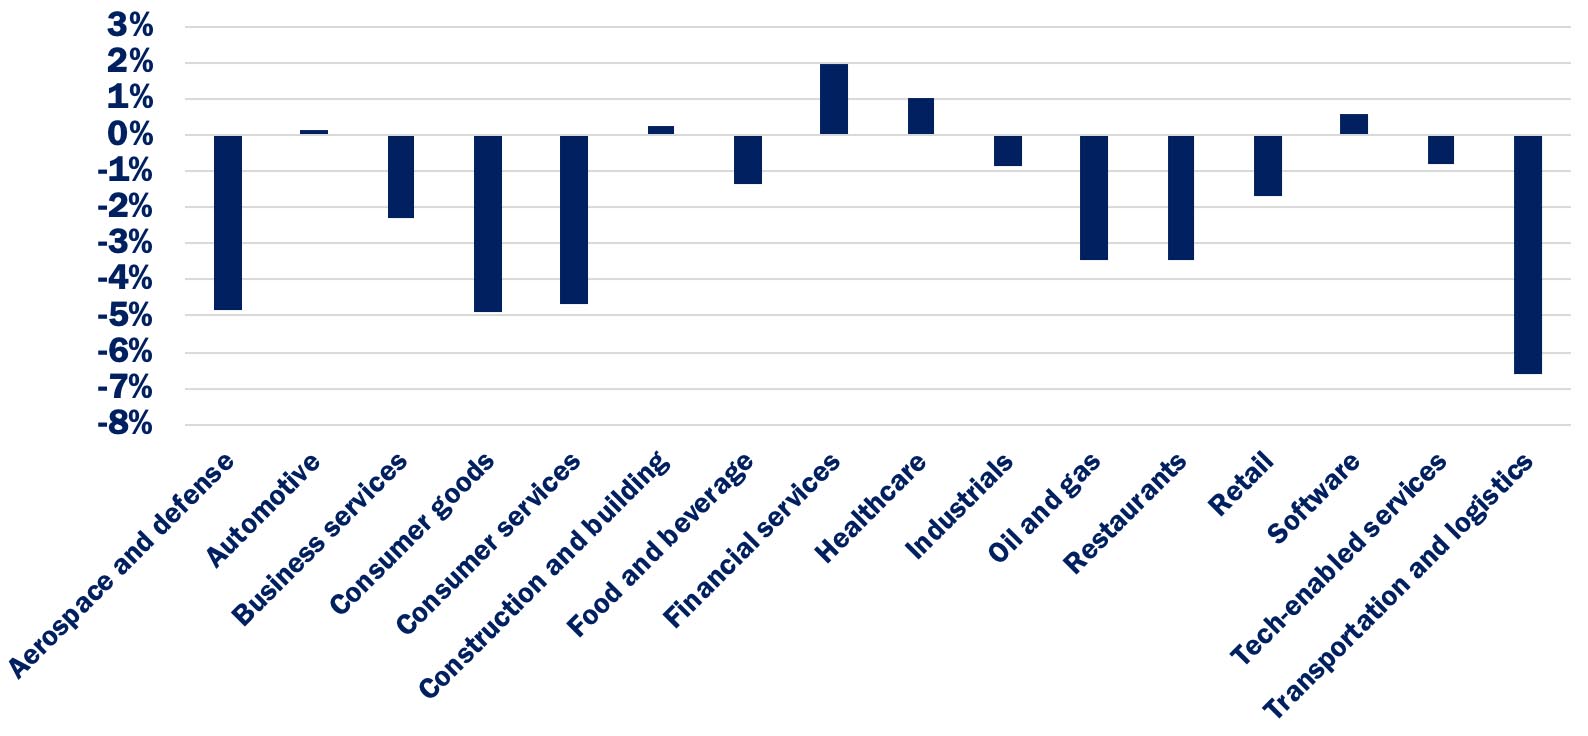
Targeted industries post-COVID-19 (% change vs. pre-COVID levels):
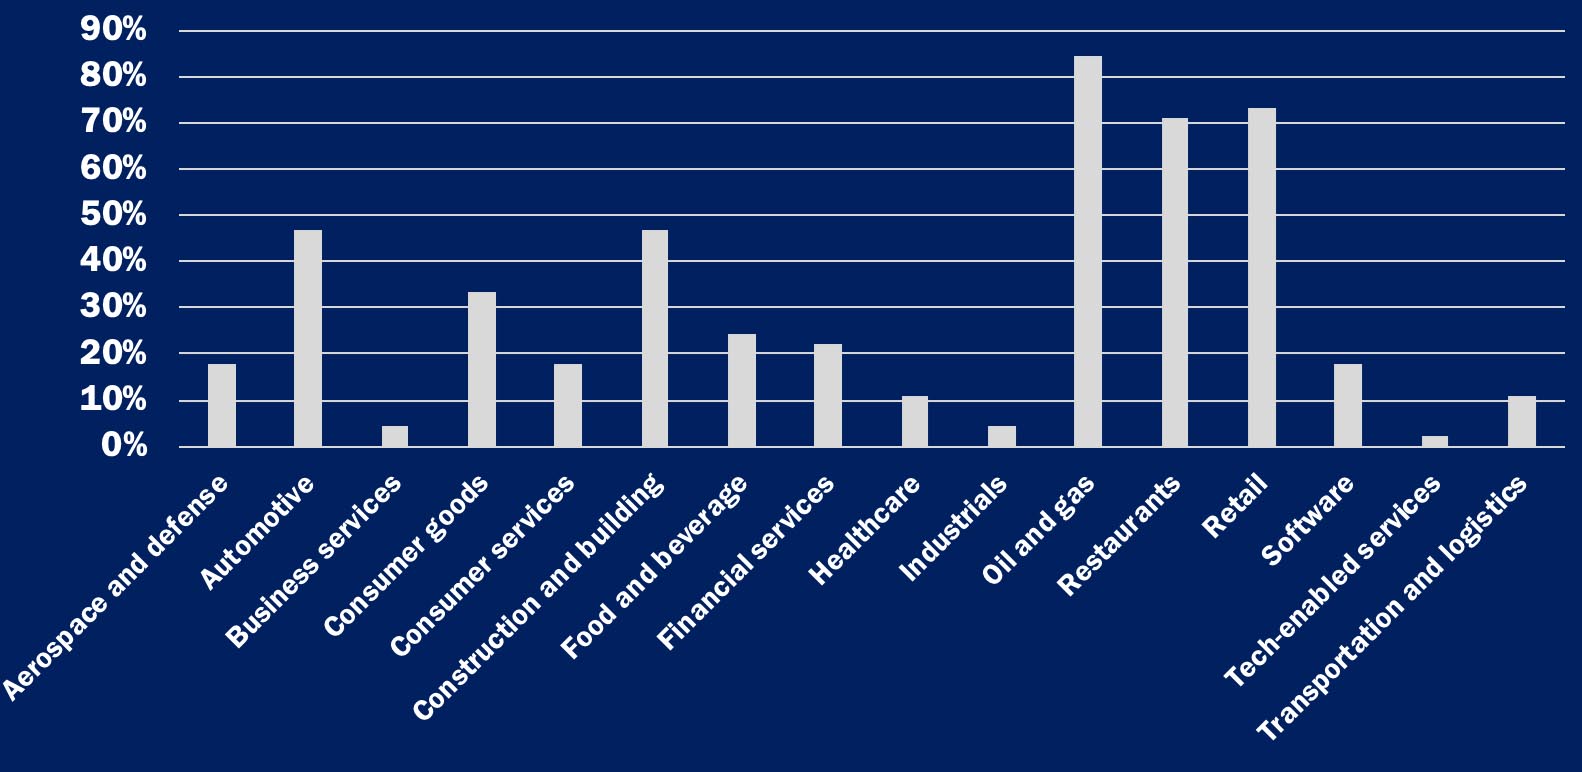
Industries to avoid pre-COVID-19 (% of respondents that focus on each sector):
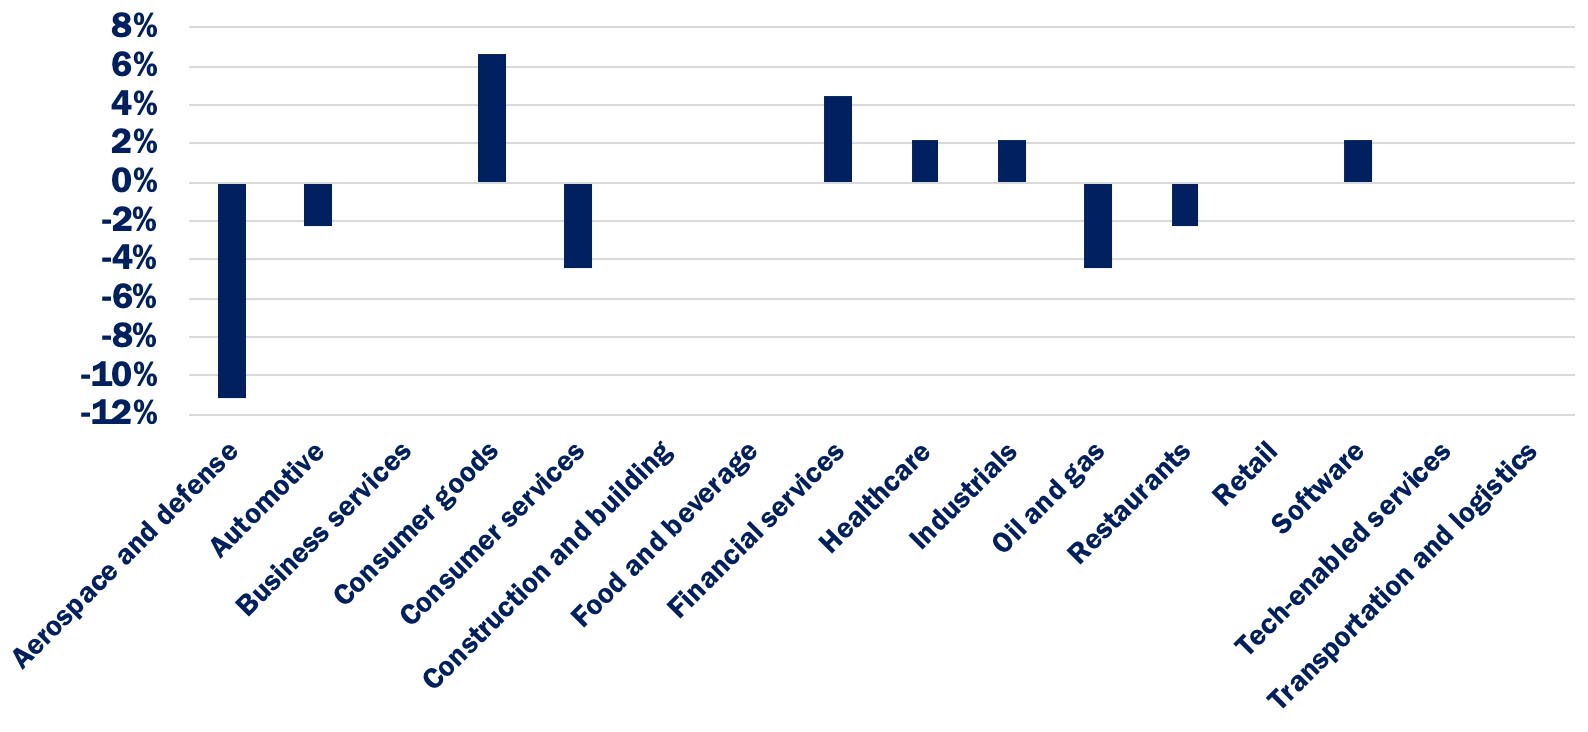
Industries to avoid post-COVID-19 (% change vs. pre-COVID levels):
TREE LINE INSIGHTS


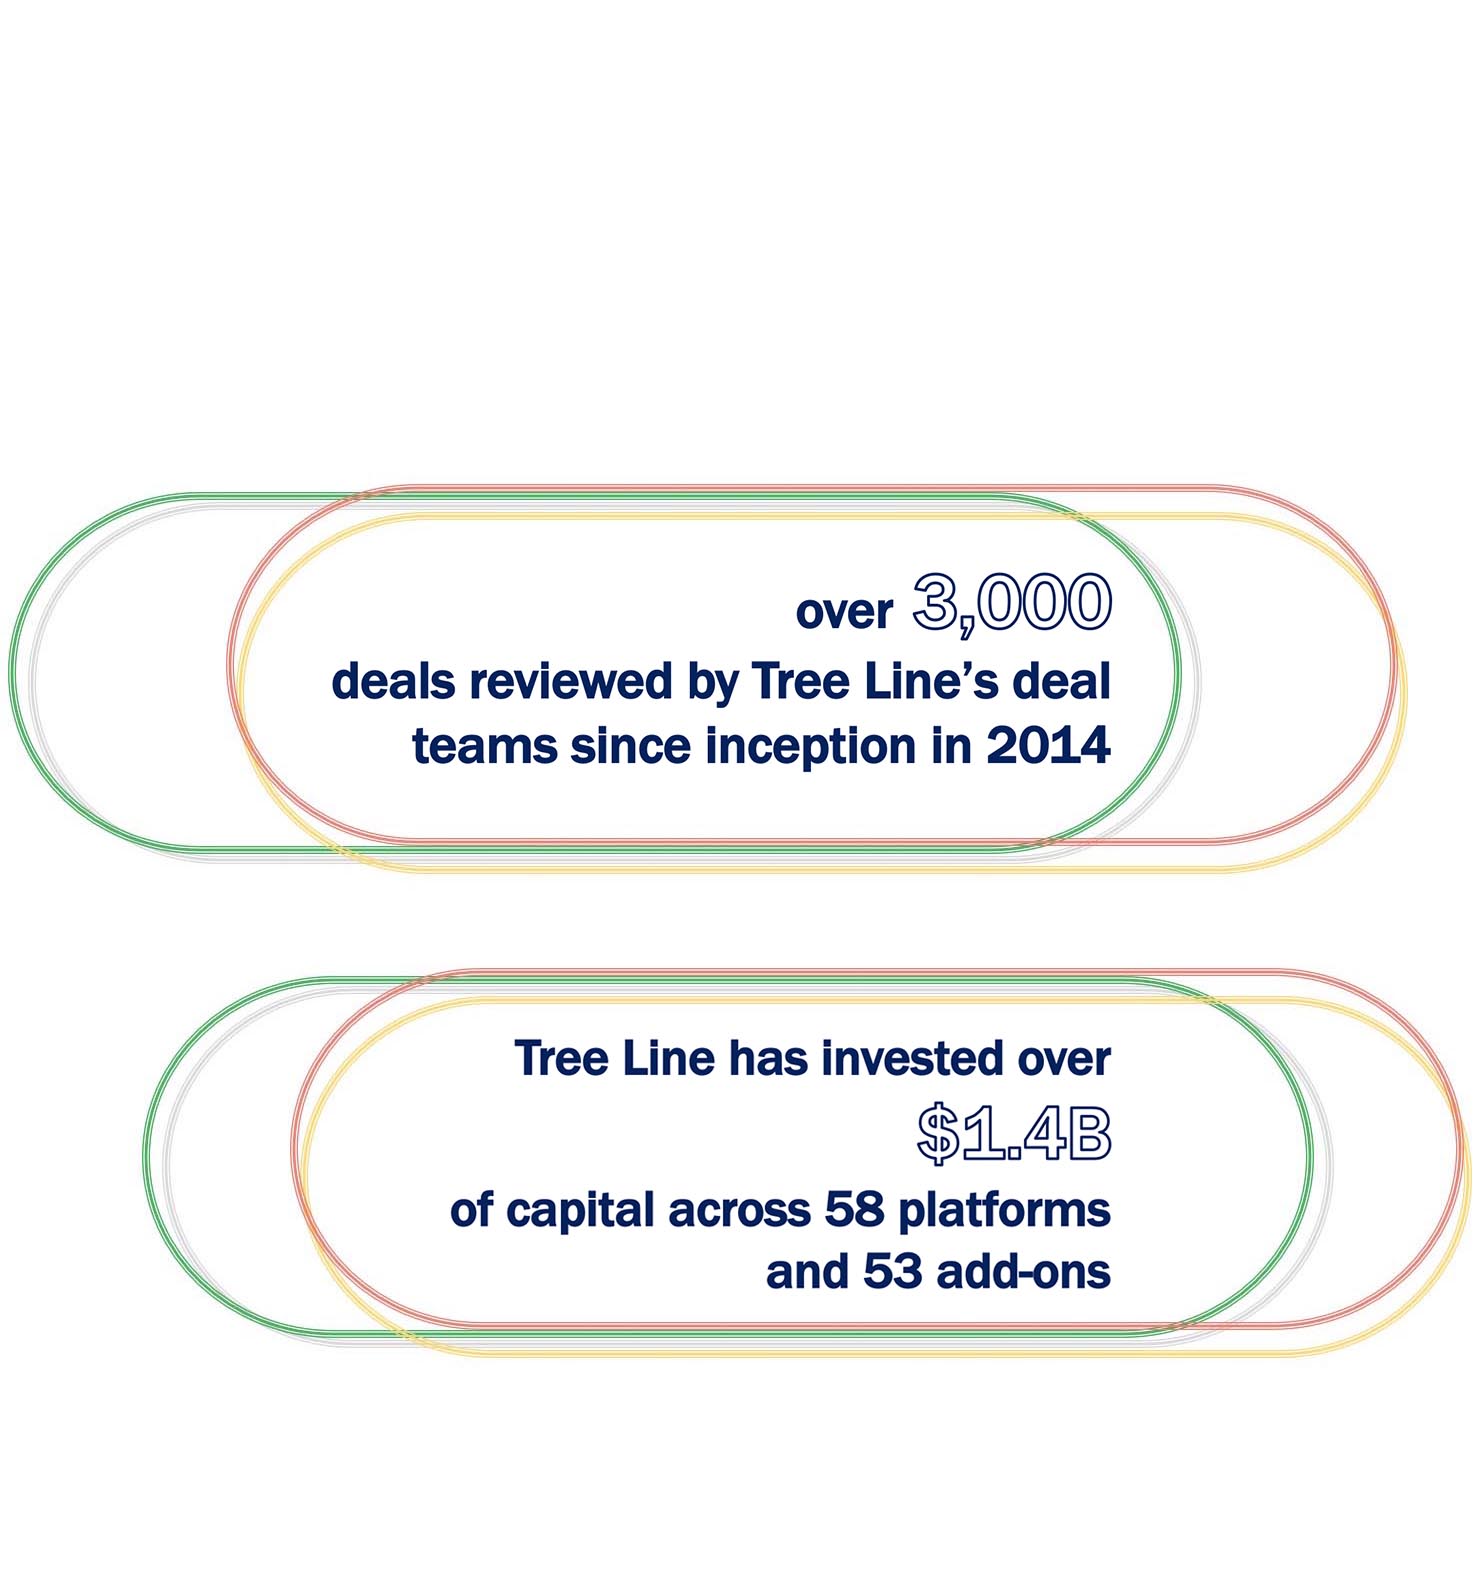
DOUBLE DIGIT PURCHASE MULTIPLES ARE DRIVING SPONSORS DOWN MARKET WHERE BETTER VALUE CAN BE FOUND AND GROWN VIA ADD-ONS
US Private Equity Buyout EV/EBITDA multiples have increased from 10.0x in 2015 to 12.7x in 20198
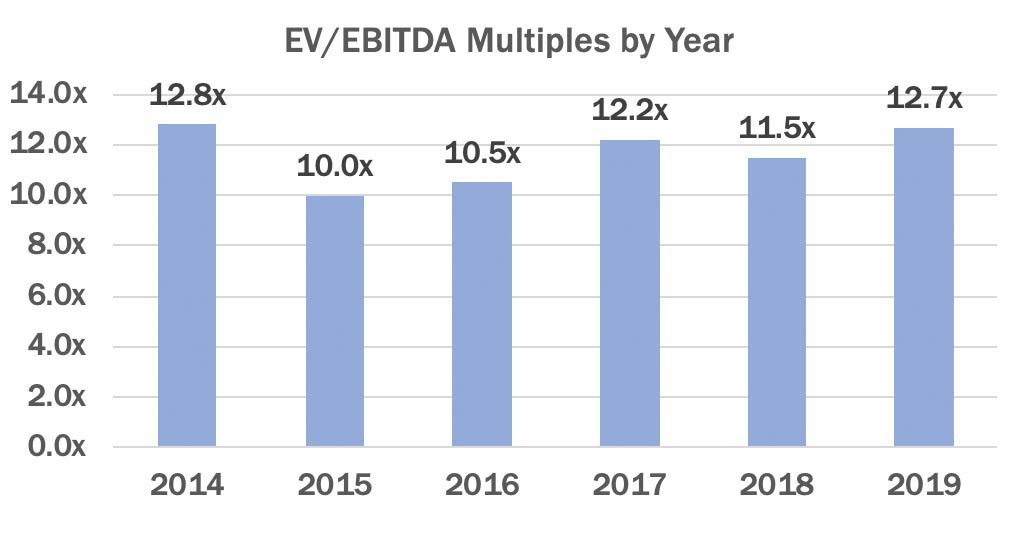
Leading to sponsors evaluate smaller platforms. Average EBITDA for Tree Line’s new deal opportunities decreased from $12.7M in 2014 to $6.9M in 2018 with a rebound to $9.1M in 2019.
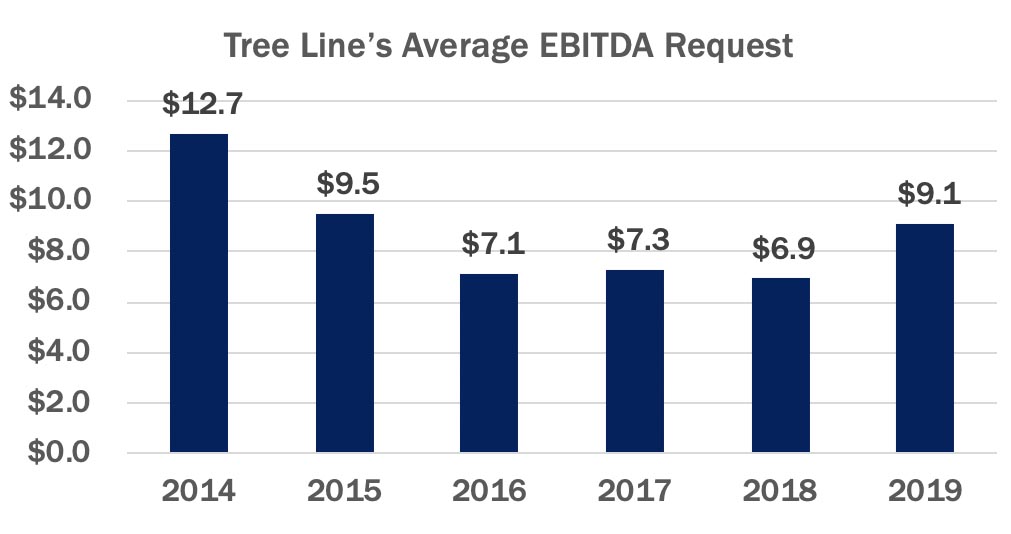
Given the move down market, sponsors have targeted growth through add-ons acquisitions, which has grown from 0% of Tree Line’s invested capital in 2014 to 35% in 2019.
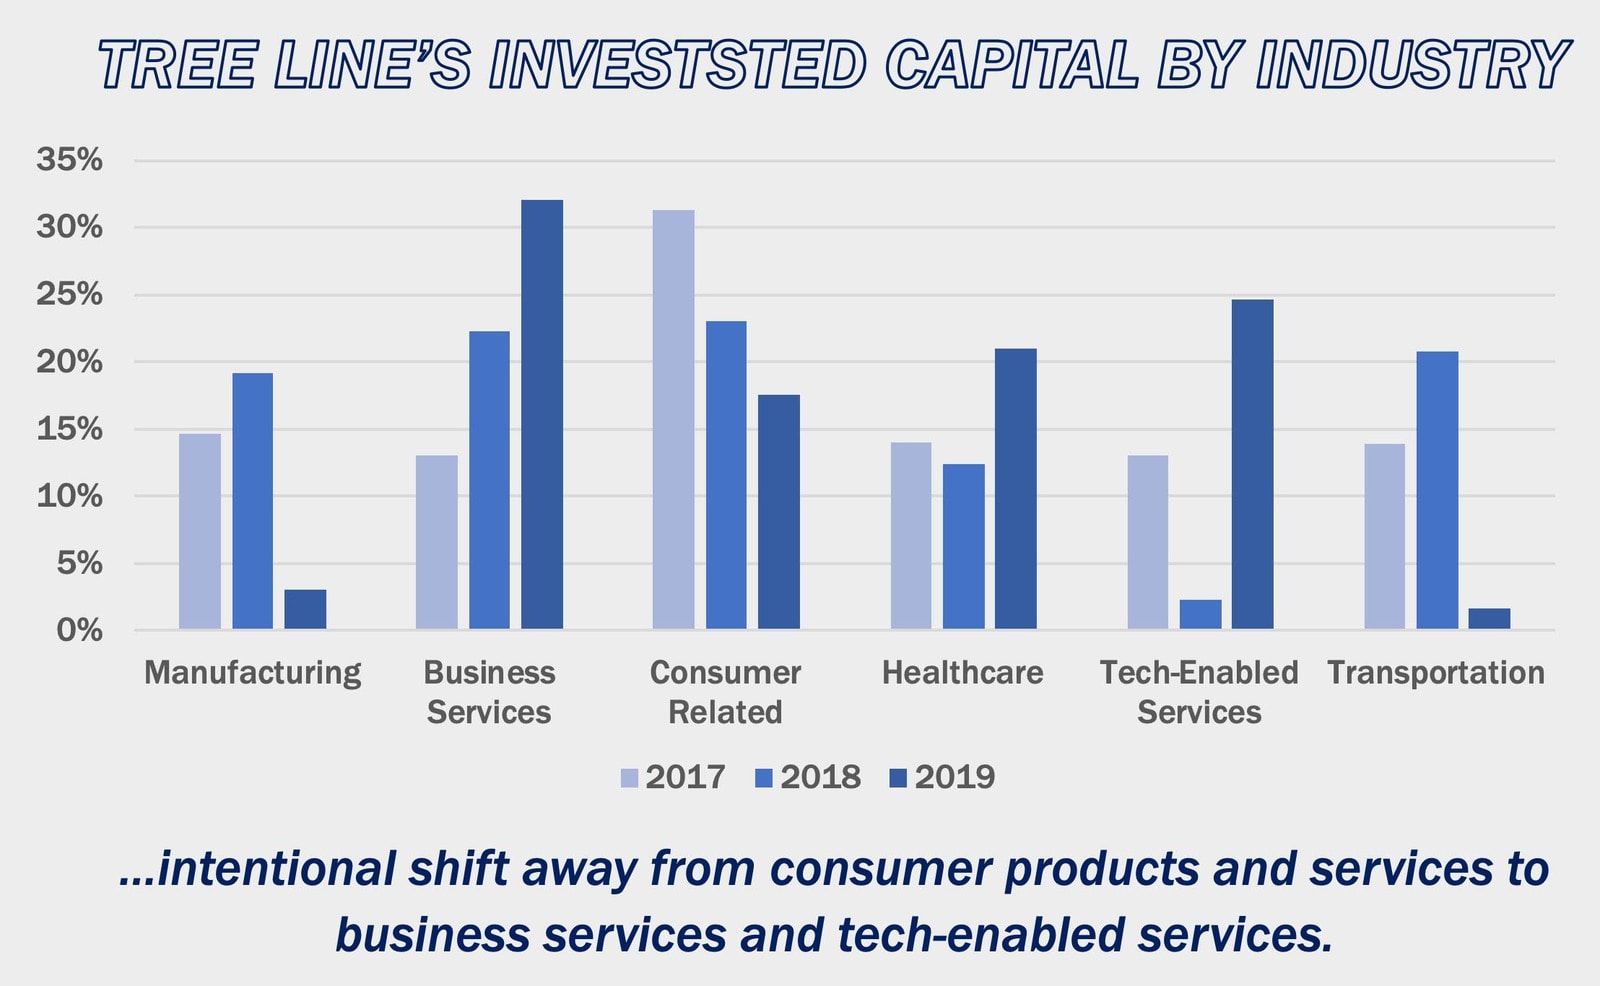
WITH AN EYE ON BUSINESSES WITH THE LOWEST PROBABILITY OF DEFAULT, TREE LINE’S PORTFOLIO CONSTRUCTION FOCUSES ON BUSINESS SERVICES AND TECH-ENABLED SERVICES INDUSTRIES.

CONCLUSIONS…
To the readers:
We could never have scripted the events that would take place in the early months of 2020. The first half of the year has confronted us with a pandemic and demands for social reform, alongside a trade war, reflation, and a significant shift in how we work, commute, travel, shop and interact as human beings. Billions of lives around the globe have been impacted by these events in profound ways.
Despite today’s challenges, we continue to believe that the LMM provides an attractive opportunity set for private credit investors. Our market is as sophisticated as it has ever been driven by increasing presence of experienced investors who are seeking to tap the advantages in our market and a wealth of accessible performance data. We’re pleased, but not surprised, to see that our private equity partners expect to remain active in this challenging climate. This is clearly shown in the Ascend survey which noted that 80% of sponsors expect to deploy the same or more capital in the next twelve months as compared to the previous twelve months.
At Tree Line, we will maintain a cautious but proven portfolio construction strategy focused on directly originated, senior secured, modestly levered, high free cash flow, sponsor-backed loans. This strategy has placed us in as strong of a position as possible entering the crisis and we are expecting a very attractive vintage going forward.
Our team has gained invaluable perspective through these trying times. In addition to our efforts to lead the LMM in market awareness through our research and data, we are also proud of our impact on our community through our 1% for the Planet initiative and giving during COVID. We will continue to strive to be a leader in the LMM for the benefit of our investors, borrowers, private equity partners and communities.
Best Regards,
The Tree Line Team
Disclaimer & Footnotes
Disclaimer
Opinions expressed in this Ascend Report are those of Tree Line Capital Partners, LLC as of August 2020 and are subject to change. Furthermore, the data contained herein is for informational and discussion purposes only and is neither an offer to sell nor a solicitation of any offer to buy any securities, investment product, or investment advisory services.
Footnotes
- Source: 2012 US Census: 2012 SUSB Annual Data Tables by Establishment Industry.
- Source: PitchBook.
- Source: PitchBook Q1 2020 US PE Middle Market Report XLS.
- Source: Tree Line internal portfolio data.
- Source: Press releases and other publicly available information.
- Source: PitchBook.
- Source: Public filings.
- Source: PitchBook Q1 2020 US PE Middle Market Report XLS.
- Source: Public filings.


